BSE sector performance and pointers for future outperformance: Part 2

In our previous article, BSE sector performance and pointers for future outperformance: Part 1, we had looked at the performance of six sector indices in BSE and some indicators for future outperformance. We should reiterate that, while historical prices can provide some indicators for future performance of a sector, sector performance depends on a variety of factors like government policies, monetary policy, global commodity prices, exchange rates and other global factors. Readers should also note that for average investors, large cap and diversified equity funds are the most suitable instruments for equity investing. Sector specific investment requires expertise and an active investment management approach. Timing is very important in sector investments, since it makes a big difference to returns in the short and medium term.
In our previous article, we had analysed the performance of the indices for Automobiles, Banks, Consumer Durables, Capital Goods, Healthcare and FMCG. In this article we analyse the performance of the IT, Metals, Oil and Gas, Power, Realty and Technology, Media & Telecom sectors in BSE. For our analysis, we have taken the daily prices of these indices for the past 5 years, from May 21 2009 to May 21 2014.
S&P BSE IT Index
The S&P BSE IT Index is the benchmark index for the Information Technology sector and comprises of select computer software stocks trading on BSE. Stocks like Infosys, TCS, Wipro, HCL Tech, Tech Mahindra, Mindtree, Mphasis etc form the S&P BSE IT Index. The IT sector is a typical defensive sector. A defensive sector is one whose earnings growth and share prices have very low correlation to the GDP growth in the economy. Irrespective of economic growth, the revenues, the earnings and the cash flows of the company remain relatively stable. Defensive sectors like IT outperform cyclical sectors like capital goods in bear markets. Sectors like IT do well in both bull market and bear market. However, in bull market cyclical sectors outperform defensive sectors. Below is the 5 year daily price chart of the S&P BSE IT Index.

We can see the 5 year trend of the S&P BSE IT Index is upwards. From May 2009 and May 2010, the IT index rose by 80%. There was a long period of consolidation from 2010 to 2012. In 2013 the IT sector outperformed the Sensex, with the S&P BSE IT index rising 60%. The primary reason for the outperformance has been the depreciation of the Rupee versus the US dollar which made the Indian IT sector competitive, in addition to the organic growth in dollar terms for the IT companies. The good performance of IT stocks continued in 2014, with the S&P BSE IT index rising nearly 10% in the first two months of the year. Since March the IT stocks have corrected a little, with the focus shifting to cyclical stocks and the slight appreciation of the Rupee. The table below shows the returns from the BSE auto index over the last 5 years (returns over 1 year are annualized).
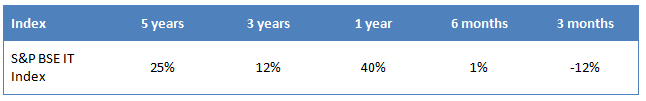
In the last 5 years, the sector has given trailing compounded annual returns of 25%. As of close of trading on May 21 2014, the BSE IT Index was nearly 17% lower than its 5 year high. If the momentum in the market subsides and the rupee depreciates, then IT stocks will be back in favour and may test its five year highs again. For IT stocks, earnings and exchange rate will be key factors in triggering the next up move. If the broader market momentum persists, in the short term, the IT sector is not likely to give high returns. However, long term potential of this sector remains very strong.
S&P BSE Metal
The S&P BSE Metal is the benchmark index of the metals sector and comprises of select large cap ferrous and non ferrous metals and minerals companies. Companies like Tata steel, Hindalco, Jindal Steel, Sesa Sterlite, Hindustan Zinc, Coal India, NDMC, JSW, SAIL etc. form the S&P BSE Metal index. Below is the 5 year daily price chart of the S&P BSE Metal.

This sector has been a rank underperformer in the last 5 years. The BSE Metal index rose over 50% from May 2009 to May 2010. However, from May 2010 the metal sector has been going through a downturn and has seen prolonged correction in share prices. From May 2010 to May 2013, the S&P BSE Metal Index corrected over 40%, as you can see on the chart above. Local and global factors contributed to the woes of the metal sector. While global commodity prices were subdued, domestic demand declined with the slowdown in capex spending. The mining sector was particularly hit hard by political scams and Supreme Court ban on mining in some states. Since August 2013, global commodity prices have started firming and the index has performed better. From May 2013 to May 2014 the BSE metal index gave a return of 38%. The table below shows the returns from the S&P BSE CG over the last 5 years (returns over 1 year are annualized).
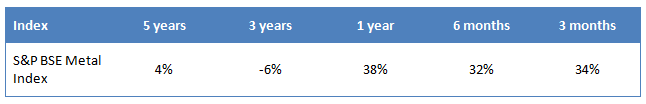
In the last 5 years the metal sector has given trailing compounded annual returns of only 4%. Recent momentum is clearly in favour of the sector since in the last three months the index has risen 34%. But we have to see, if there is conviction in the up move, since the move has taken place only in the last 3 months. The metal sector is a cyclical sector and should do well when economic growth revives. The sector is 55% lower than its 5 year high. This can give the investors, a sense of returns they can expect from this sector, if the positive trend continues. However, the timeframe in which the sector can go back to its 5 year high is still a question. Investors need to watch this sector and be selective about stock picking.
S&P BSE OIL AND GAS
The S&P BSE OIL AND GAS is the benchmark index of the Oil and Gas sector and comprises of select large cap companies in the oil exploration and refineries industry. Companies like Reliance, ONGC, Cairn India, Indian Oil, BPCL, HPCL, GAIL etc. form the S&P BSE OIL AN GAS. Below is the 5 year daily price chart of the S&P BSE OIL AND GAS.
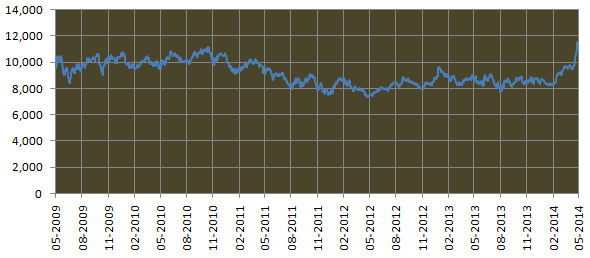
The oil and gas sector has also been a rank underperformer in the last 5 years. We can see in the chart above that the 5 year trend of this sector, until recently, has been sideways and very choppy. The S&P BSE OIL AND GAS index has traded in the band of 8,000 and 11,000 with no breakouts in this 5 year period. The refineries, which are largely importers of crude oil, have been hit by the depreciation of the Rupee and subsidies for consumers. Prices of petroleum products are very politically sensitive. However, the huge subsidy burden is a structural problem for PSU oil companies, both upstream (e.g. ONGC) and downstream (e.g. BPCL, HPCL etc.). On the gas exploration front, the lack of clarity on government policy on gas prices had also affected the share price of gas exploration companies like Reliance. The Oil and Gas index was fell 22% from May 2009 to May 2012. From May 2012 to May 2013 the index rose 18%. In the last one year, the index rose 26%, with almost the entire gain coming in the last 3 months. The table below shows the returns from the S&P BSE OIL AND GAS over the last 5 years (returns over 1 year are annualized).
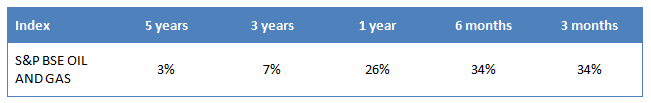
In the last 5 years the Oil and gas sector has given trailing compounded annual returns of only 3%. The new NDA Government is expected to implement wide ranging reforms in the oil and gas sector, and expectations have led the oil and gas sector index to rise 34% in the last 3 months. But we have to see, if there is conviction in the up move, since the move has taken place only in the last 3 months. Since the prospect of this sector is dependent on government policies, investors need to watch this sector carefully before taking aggressive sector bets. However, if reforms are implemented, this sector has very strong potential and will scale new highs. Investors should follow this sector carefully.
S&P BSE Power
The S&P BSE Power is the benchmark index of the power sector and comprises of select large cap companies in this sector. Companies like BHEL, NTPC, NHPC, Reliance Power, Tata Power, Adani Power, Power Grid, GMR Infra etc. form the S&P BSE Power Index. The power sector is a typical cyclical sector. This sector has been underperforming since the end of 2010 to as recently as March 2014. Below is the 5 year daily price chart of the S&P BSE Power.
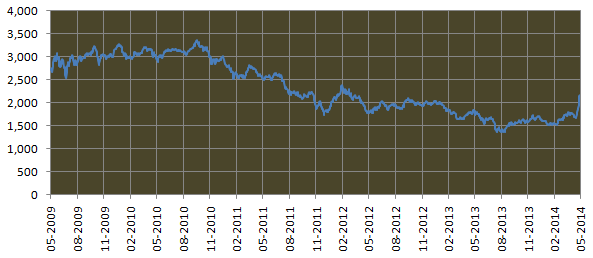
This sector has been a rank underperformer in the last 5 years. The index saw a sharp correction of 40% in 2011. The downtrend persisted through 2012 and 2013. Over the entire 5 year period the performance has been extremely choppy. From May 2012 to May 2013, the index was basically flat. It again corrected sharply by 24% from May to August of 2013. However, the index bottomed out in August 2013 and then has been mostly flat. During this five year new power projects were badly hit due to problems with environmental clearance. Fuel supply shortage is another chronic issue plaguing the power sector. The coal scam also did a lot of harm to the sentiments regarding this sector. Many power sector experts attribute the overall problems of this sector, to the “policy paralysis” of the outgoing government. However, the index has risen sharply after March 2014, with the expectation of an NDA win in the recently held Lok Sabha elections. The table below shows the returns from the S&P BSE Power over the last 5 years (returns over 1 year are annualized).
In the last 5 years the power sector has given trailing compounded annual returns of -4%. However, recent momentum is clearly in favour of this sector. In the last three months the index rose by 39%. The index is still 57% away from its 5 year high. This can give the investors, a sense of returns they can expect from this sector, in the short to medium term, if the positive trend continues. Since the prospect of this sector is dependent on government policies, investors need to watch this sector before taking aggressive sector bets. Power sector reforms are likely to be high on the agenda of the new government. Investors should watch this sector carefully. This sector has the potential of giving high returns, if it gets the right impetus from government policies.
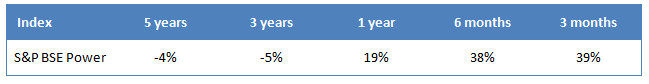
S&P BSE Realty
The S&P BSE Realty is the benchmark index of the Real Estate sector and comprises of select large cap companies in this sector. Companies like DLF, HDIL, Indiabulls Real Estate, DB Realty, Omaxe Unitech etc. form the S&P BSE Realty. The real estate sector is a typical cyclical sector. Below is the 5 year daily price chart of the S&P BSE HC.

This sector is the biggest underperformer among all BSE sectors in the last 5 years. The trend has been relentlessly downwards, some brief spikes in price notwithstanding. The index rose 40% in 2009, but gave up all its in 2010. It again rose 30% in 2010, but gave all its gains before the end of the year. Since 2010, the index has been in a downtrend and is forming lower bottoms. From May 2012 to May 2013 the index gave a return of 24%, but from May 2013 to May 2014 the index gave negative return of -7%. The table below shows the returns from the S&P BSE Realty over the last 5 years (returns over 1 year are annualized).
In the last 5 years, the sector has given trailing compounded annual returns of -11%. Though this sector has shown a lot of momentum in the last three months, rising 52%, this has been off a low base. We have to see if there is conviction in the up move. The index is 164% lower than its 5 year high. Investors should carefully evaluate before taking aggressive bets in this sector, as it is very risky.
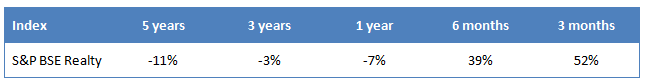
S&P BSE TECk
The S&P BSE TECk is the benchmark index of technology, media and telecom sector and comprises of select large cap companies in this sector. Companies like Bharti Airtel, Reliance Communications, Tata Communications, Zee Entertainment, HCL Tech, Dish TV, Bharti Infratel, etc. form the S&P TECk. Below is the 5 year daily price chart of the S&P BSE TECk.

This sector index rose 25% from May 2009 to Sep 2009. From Sep 2009 to August 2013, the index has been range bound between 3,000 and 4,000. After August 2013, the index saw a breakout and rose 15% till January 2014. From February 2014, the index has declined marginally by 5%. The table below shows the returns from the S&P BSE TECk over the last 5 years (returns over 1 year are annualized).
In the last 5 years, the sector has given trailing compounded annual returns of 15%. As of close of trading on May 21 2014, the BSE TECk index was 10% away from its 5 year high. However, with cyclical stocks back in favour investors, this sector may not see outperformance in the near term.
Conclusion
In this series of two articles, we have seen how each sector in BSE performed over the last 5 years. We have also got some pointers for potential future outperformance or underperformance. We should reiterate that, for sector specific investments, timing, both entry and exit is very important. These investment ideas are suitable for informed and active investors. Investors should do their research and consult with their brokers or financial advisers before making any investment decision.


Queries
-
What is the benefit of mutual fund STP
Aug 29, 2019
-
How much to invest to meet target amount of Rs 2 Crores
Aug 26, 2019
-
Can I achieve my financial goals with my current mutual fund investments
Aug 24, 2019
-
Can you tell me return of various indices
Aug 19, 2019
-
What would be the post tax return on different investments
Aug 18, 2019
-
Which Principal Mutual Fund scheme will be suitable for my retirement corpus
Aug 16, 2019
-
What is the minimum holding period for availing NCD interest
Aug 4, 2019
Top Performing Mutual Funds

Recommended Reading


Fund News
-
Leveraging the PSU rally to sustain capex growth
Apr 10, 2024 by Axis Mutual Fund
-
Bandhan Mutual Fund launches Bandhan Innovation Fund
Apr 10, 2024 by Advisorkhoj Team
-
Tata Mutual Fund launches Tata Nifty500 Multicap Infrastructure 50:30:20 Index Fund
Apr 8, 2024 by Advisorkhoj Team
-
Tata Mutual Fund launches Tata Nifty500 Multicap India Manufacturing 50:30:20 Index Fund
Apr 8, 2024 by Advisorkhoj Team
-
Tata Mutual Fund launches Tata Nifty Realty Index Fund
Apr 8, 2024 by Advisorkhoj Team