Financial Glossary starting with Alphabet Y

-
Yield - Significance in Bond Market
When equity markets are bullish we say the “Sensex” has “gone up” or “Equity prices” have “gone up” or “NAVs” have “gone up” . But, when bond markets are bullish we say “yields” have “gone down”.
When bond markets move up we say the “yields” have gone down whereas when bond markets fall we say the “yields” have gone up. Thus, there seems to be an inverse relationship between the markets and the “yields”
However, It is quite the opposite with Equity Markets where the “SENSEX” is said to go up with rising markets and go down with falling markets. Thus, There seems to be a direct relationship between the equity markets and the SENSEX. AND why is the SENSEX used to judge equity markets and why is it that “Yields” are used to judge Bond Markets?
Both Equity and Bond ( or Debt) markets are platforms for organizations to raise capital (or collect money) for running their businesses. While in equity markets the business offers its shares to investors who are willing to take unlimited risks if the business fails and hope for big gains if the business succeeds.
When markets are positive or have a rising trend or are bullish as is commonly spoken of, the business can get more money for every share it has to offer to investors who use the equity market as a platform to invest.
Now let’s see what happens in the case of a Bond market. In a bond market the business raises debt capital where the investors invest money for a fixed period at a particular rate of interest. When the bond markets are bullish/ positive it means there are enough investors in the market who are willing to lend money.
In such a situation the business can expect to raise capital (pick up money from investors) at a lower interest rate or “lower yield”. Hence we say that “when bond markets are bullish the yields fall”.
Let us uderstand with an example.
Let’s say I issue a debt instrument (or debt paper) of Rs. 100 each at 10% interest per annum to the investor. This essentially means that an investor who lends me Rs 100 for one year will earn Rs 10 at the end of the year. Thus at the end of the year I will return Rs. 110 (Rs 100 + Rs 10)
Now in a bullish market there are several investors who want to invest and the instruments or papers are relatively in short supply. In such a situation, perhaps I would find an investor who is willing to pay Rs105 for my debt instrument for which I had paid Rs 100 to the original issuer for earning a 10% interest
In this situation I become the issuer to the new investor who purchased the debt paper from me for Rs 105.
Now let’s see at what yield I got to raise money. To figure this out, we will have to see what the investor (who bought the debt paper from me) earned from the investment. At the end of one year he would receive
Rs. 110 from the original issuer of the debt paper
( Rs. 100 [principal] + Rs. 10 [interest] ) because the coupon rate or the rate mentioned on the debt paper (debt instrument) is 10% of basic cost of Rs100
Hence the earning of the new investor works out to be - Rs 110 – Rs 105 = Rs 5 (Final amount received – Initial amount invested)
And the amount of interest he earns works out to -
(Profit/Invested amount) x 100
= {5 / 105}%
= 4.7%
This is the yield that the investor gets from the debt paper which he purchased from me in a bullish/positive market.
Thus I could raise capital at a lower yield of 4.7% because of bullish market conditions. Thus we see through this example that in bond markets when the state of the market is bullish the yields actually come down and one is able to raise capital at lower interest rate.
Thus we can say in a debt market I can raise capital at lower yield in a bullish market. But in the case of bullish equity markets I would have got a higher price for my shares. Thus in an equity market I can raise capital at higher valuation.
Thus there is a direct relationship between bullish equity market and share price while in the case of bond markets the relationship between the bullish bond market and yield is inverse in nature. Though this concept is simple many a times people get confused and simply memorize that “when bond prices go up yields come down and vice versa” (source: Tata Mutual Fund) -
Yield Curve - Unraveling
• In finance, the yield curve is the relation between the interest rate (or cost of borrowing) and the time to maturity of the debt for a given borrower in a given currency.
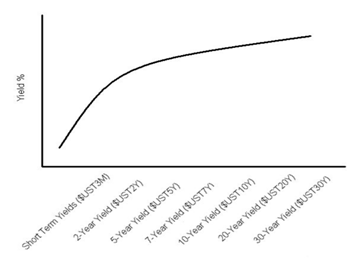
• For example, the current U.S. dollar interest rates paid on U.S. Treasury securities for various maturities are closely watched by many traders, and are commonly plotted on a graph informally called the ‘yield curve’ which is depicted in the previous slide.
So what is ‘yield’? The yield of a debt instrument is the annualized percentage increase in the value of the investment. For instance, a bank account that pays an interest rate of 4% per year has a 4% yield.
In general, The percentage per year that can be earned is dependent on the length of time that the money is invested. This earning for having invested your money in a particular investment instrument is called as ‘yield’. Also, it is important to understand that the yield is not directly proportional to the length of the investment. ( It is not a straight line relationship)
So what are the uses of the Yield Curve?
• Yield curves are used by fixed income analysts, who analyze bonds and related securities, to understand conditions in financial markets and to seek trading opportunities.
• Economists use the curves to understand economic conditions.
• The yield curve function Y is actually only known with certainty for a few specific maturity dates. The other maturities are calculated by interpolation.
The typical shape of a Yield Curve
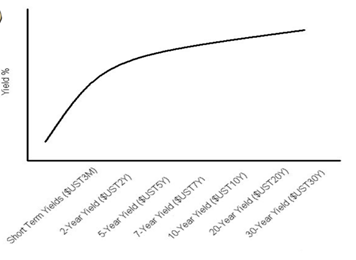
Now…
Yield curves are usually upward sloping i.e. the longer the maturity, the higher the yield, with diminishing marginal growth (which means that after a point every increase in duration will bring lesser incremental return).
This is because It is easier to predict the near term as against the long term. Hence, short term papers are usually held by the investor till its maturity. And long term instruments are usually traded in the market as their returns get affected by changes in interest rates, which occur regularly in an economy.
• The yield curve can also be flat or even concave in shape where the short term yield is seen to be more than than the long term yield.
• This is being witnessed currently wherein overnight interest rates (call money rates) soared due to the liquidity crunch.
• Yield curves move on a daily basis, reflecting the market's reaction to news. (source: Tata Mutual Fund) -
Yield Gap
Yield gap is the ratio of the dividend yield of an equity and the yield of a long-term government bond. Typically equities have a higher yield (as a percentage of the market price of the equity thus reflecting the higher risk of holding an equity.

The purpose of calculating the yield gap is to assess whether the equity is over or under priced as compared to bonds. For a given equity, the following cases may be considered:
- If the yield gap is numerically small, then equity yield is lower than bond yield implying that the equity is overpriced.
- If the yield gap is numerically large, then equity yield is higher than bond yield implying that the equity is cheap.

Recent Articles


Top Performing Mutual Funds
Tools and Calculators