

How to deal with Volatility
What is volatility?
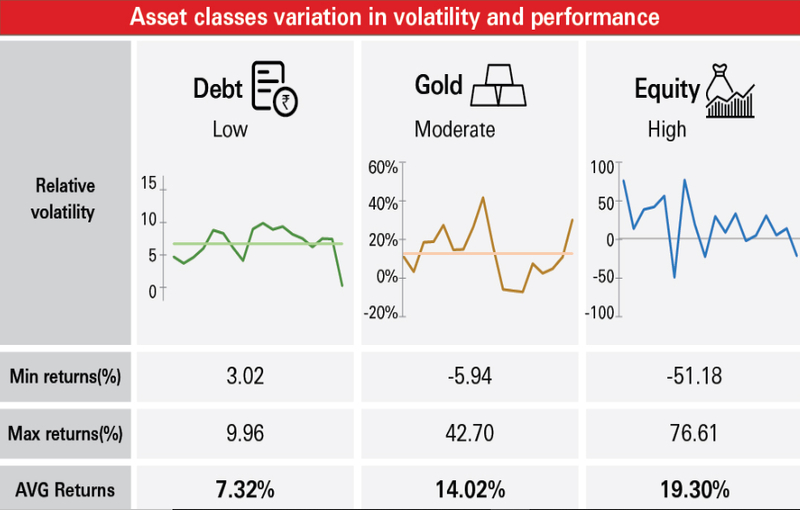
Volatility is the fluctuation in the price of an asset. Asset prices are rarely unidirectional in the short term. Some asset classes are much more volatile than others e.g. equity is much more volatile than fixed income or gold. Volatility is the measure of risk in an investment.
The chart below shows the price movement of Nifty 50 over the past one year. You can see the Nifty has turned very volatile since the beginning of this year.

Source: NSE, Advisorkhoj Research
Why do we have volatility?
Stock prices move up and down depending on the demand and supply situation in the market. When demand for stocks is high, prices go up and vice versa when demand is low. Demand and supply depends on a variety of factors like major global risk events (e.g. dotcom bubble, 9/11, global financial crisis, Eurozone debt crisis, COVID – 19 etc), domestic risk factors, economic outlook (growth, slowdown, recession etc), sector specific factors, stock specific factors etc. Sometimes periods of high downside volatility (price fall) can be long and can result in significant price corrections. These periods are usually called bear market periods. However, the long term secular trend in equity is upwards (please see the chart below).

Source: NSE, Advisorkhoj Research
How is volatility measured?
Volatility is measured by a statistical parameter known as standard deviation. Standard deviation measures the dispersion of the returns (both up and down) relative to the average return over the period of measurement. Higher the standard deviation, higher is the volatility of the scheme. The standard deviation of scheme returns are disclosed in the mutual fund factsheets.
How should you approach volatility?
It is important for investors to understand volatility because incorrect understanding will lead to wrong decisions which may be detrimental to your financial interests. You should know the difference between volatility and loss.
The value of your investments in mutual fund schemes will reflect volatility because the scheme NAV includes the daily closing prices of the underlying securities. However, volatility leading to reduction in the value of your investment results in only a notional loss.
Notional loss is temporary. When the prices of the underlying securities recover, your notional loss will go away and may turn into a gain. On the other hand, if you redeem units of your mutual fund scheme when the value is down, the notional loss gets converted into a permanent loss. If you want to avoid a permanent loss, you should remain invested and refrain from redeeming when prices are down.
Volatility reduces over time
Diversified equity mutual funds aim to diversify stock specific risks but are subject to market risks. Though market cycles (bull and bear markets) are inevitable, you can see from the chart above the market has always recovered after a period of time. Therefore, you should have long investment horizons for your equity investments. In fact, probability of making a loss or getting lower returns reduces over long investment tenures.
The chart below shows 1 year rolling returns of Nifty 50 TRI since 1st January 2000. You can see that Nifty has been volatile over 1 year investment tenures. The investor with 1 year tenure would have made a loss around 26% of the times over the last 20 years.The standard deviation of 1 year rolling returns over this period was 26.9%.

Source: Advisorkhoj Research
Let us now see, what happens over longer investment tenures. The chart below shows the 3 year rolling returns of Nifty 50 TRI over the last 20 years. You can see volatility is lower compared to 1 year investment tenures. The probability of making a loss reduces over 3 year tenure – only 6% versus 26% in the case of 1 year tenure. The standard deviation of 3 year rolling returns over this period was 13.7%.

Source: Advisorkhoj Research
Let us see, if volatility reduces more over even longer tenures. The chart below shows the 5 year rolling returns of Nifty 50 TRI over the last 20 years. You can see that volatility reduces even further. The percentage of instances when a loss was made over the investment tenure was close to zero. Also the percentage of instances when you got more than 8% CAGR returns was higher (nearly 80% of the instances) compared to shorter tenures. The standard deviation of 5 year rolling returns over this period was 10%.

Source: Advisorkhoj Research
Let us now see the performance of Nifty over very long tenure. The chart below shows the 10 year rolling returns of Nifty 50 TRI over the last 20 years. You can see volatility reduced even further. There was no instance of Nifty giving negative returns over 10 years investment tenure in the last 20 years. The more interesting observation is that, Nifty gave in excess of 8% CAGR 10 year returns in 94% of the instances over the last 20 years. The standard deviation of 10 year rolling returns over this period was 4.3%.

Source: Advisorkhoj Research
Summary of key statistical measures

Source: Advisorkhoj Research
What should you do to not let volatility effect you?
Volatility can be stressful for investors depending on their financial situation and investment experience – after all, nobody likes the spectre of losing their hard earned money. Here are some suggestions.
- Understand the difference between volatility and loss. You will make a loss only if you redeem when prices are low.
- The table above clearly shows that volatility reduces over longer investment tenures. Therefore, you must have long tenures for your equity investments.
- A goal based investment approach can help you remain disciplined and not be affected by price movements. For example, if you are investing for your retirement planning and your goal timeline is 20 years, then short to medium term price movements will have no effect on your goals.
- Investing through the SIP route for your long term goals is one of the best approaches that can help you remain disciplined in your long term financial goals.
- If you have lump sum funds but are worried about prices correcting in the near term, then you can invest your money in a low risk debt fund like liquid fund and use STP to invest in equity fund to take advantage of volatility
- Always invest according to your risk appetite. If you are a relatively new investor, you can invest in less volatile asset types e.g. large cap funds.
- Enlist the help of a financial advisor if required, to help you understand your risk appetite and navigate you through difficult times.
Additional reading material - Infographic on Volatility
Issued as an investor education initiative by HSBC Mutual Fund
Mutual Fund Investments are subject to market risk, read all scheme related documents carefully.

We are a global asset manager with a strong heritage of successfully connecting our clients to global investment opportunities.
Our proven expertise in connecting the developed and developing world allows us to unlock sustainable investment opportunities for investors in all regions. Through a long-term commitment to our clients and a structured and disciplined investment approach, we deliver solutions to support their financial ambitions.
Other Links
POST A QUERY


