Union Active Momentum Fund: Long term wealth creation using momentum investing

Union Active Momentum Fund has completed 1.5 years since its launch. After a tepid start, the fund has started outperforming its benchmark index in 2026. The fund has also been outperforming its peer active momentum fund schemes. The fund used momentum to select and exit stocks in its portfolio. In this article we will review Union Active Momentum Fund.
How momentum investing works?
Momentum, in the context of equity markets, refers to the tendency of stock price trends to persist. In very simple terms it means that prices follow a trend - if stock prices are rising, it may rise further and if stock prices are falling, it may fall further. Momentum factor investing refers to taking advantage of this market behaviour to generate better returns than markets. It is essentially based on owning securities that have shown favourable price trends. Instead of the conventional, "buy low, sell high" approach, momentum strategy is essentially, "buying high and sell higher".
Why momentum investing?
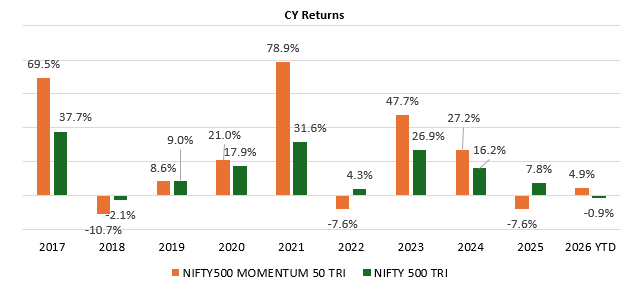
- The chart below shows the calendar year returns of the momentum index versus the broad market index over the last 10 years. You can see that momentum strategy has the potential to outperform the broad market.
Source: NSE, Advisorkhoj Research, as on 18th August 2026
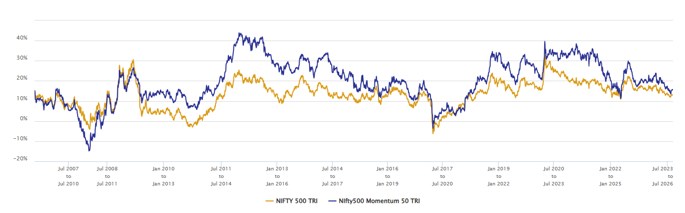
- The chart below shows the 3 year rolling returns of momentum index versus the broad market index over the last 20 years. You can see that over long investment tenures momentum consistently outperforms the broad market
Source: NSE, Advisorkhoj Research, as on 31st
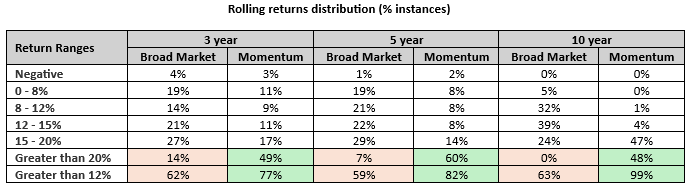
The table below shows the rolling returns distribution of the momentum index versus the broad market index over the last 20 years. You can see that the over 3 year, 5 year and 10 year investment tenures the percentage instances of 12%+ and 20%+ CAGR returns of the momentum index is significantly higher.
Source: NSE, Advisorkhoj Research, as on 31st July 2026. Broad market is represented by Nifty 500 TRI and Momentum is represented by Nifty500 Momentum 50 TRI
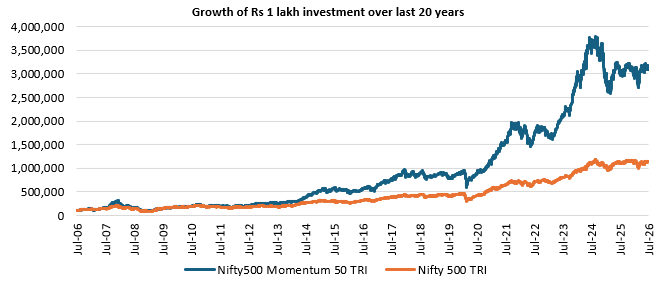
- Historical data shows that momentum has significantly higher wealth creation potential compared to the broad market index (see the chart below).
Source: NSE, Advisorkhoj Research, as on 31st July 2026
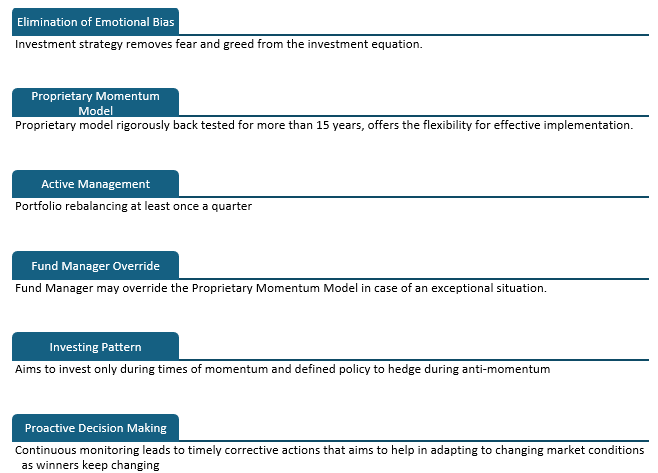
Union Active Momentum Strategy
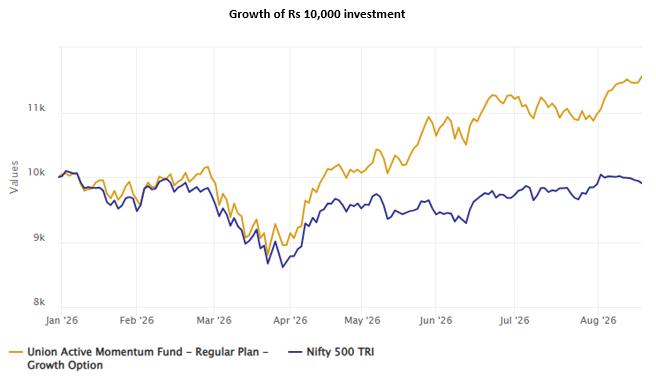
Union Active Momentum Fund - Outperforming the benchmark index in 2026
The chart below shows the growth of Rs 10,000 investment in Union Active Momentum Fund versus the benchmark index, Nifty 500 TRI since the beginning of calendar year 2026 (as on 18th August 2026). You can see that the fund has outperformed the benchmark index.
Source: Advisorkhoj Research, as on 18th August 2026
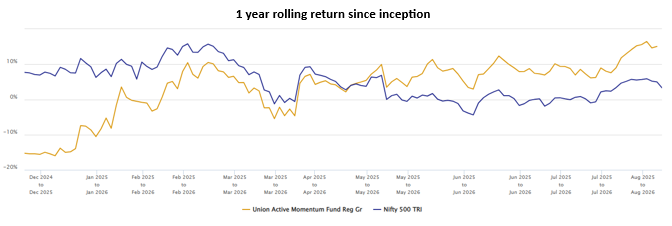
The chart below shows the 1 year rolling returns of Union Active Momentum Fund versus its benchmark index. While the fund underperformed versus the benchmark index in the initial months, you can see that it has started outperforming the benchmark index.
Source: NSE, Advisorkhoj Research, as on 18th August 2026
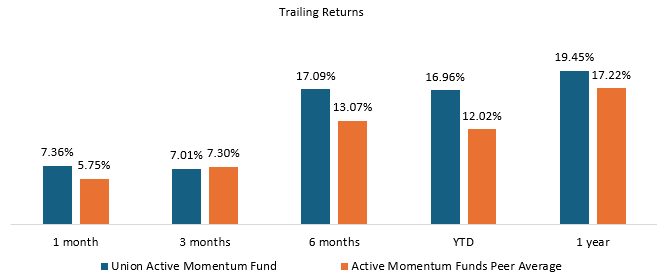
The chart below shows the returns of Union Active Momentum Fund versus its peer average (other active momentum funds) for various investment periods during the last 1 year. You can see that the fund was able to outperform its peers during these periods.
Source: NSE, Advisorkhoj Research, as on 29th August 2026
Portfolio structure
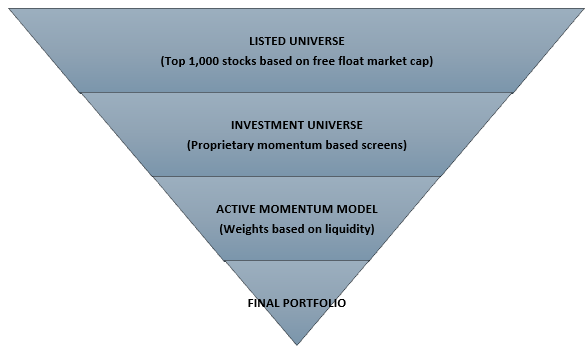
Current portfolio positioning
The portfolio currently has a small / midcap bias. Small caps constitute 69% of the portfolio and midcaps constitute 20%. Large caps constitute 7.25% of the portfolio (source: Union MF, as on 31st July 2026).
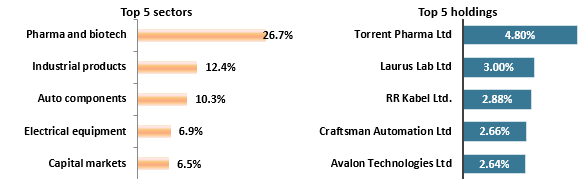
Source: Union MF, as on 31st July 2026
Who should invest in Union Active Momentum Fund?
- Investors looking for capital appreciation over long investment tenures
- Investors with high-risk appetites
- Investors with minimum 5-year investment horizon
- Investors can invest in lump sum or SIP
- Investors should consult their financial advisors or mutual fund distributors if Union Active Momentum Fund is suitable for their investment needs.
Mutual Fund Investments are subject to market risk, read all scheme related documents carefully.
RECOMMENDED READS
- Union Income Plus Arbitrage Active FOF: Jugal Bandi of stability and tax efficiency
- Union Small Cap Fund: On an improving performance trajectory versus benchmark and peers
- Union Diversified Equity All Cap Active FOF
- Union Childrens Fund: Investment for your childrens future
- Union Innovations and Opportunities Fund: Strong outperformance
LATEST ARTICLES
- Tukka Nahi Tareeka Chahiye: Why Multi Asset Allocation Deserves a Place in Your Portfolio
- Union Multi Asset Allocation Fund: Stability in volatile market
- Union Small Cap Fund: Outperforming benchmark and peers
- Arthaya Equity Long Short SIF: Potential to exploit opportunities across market conditions
- Union Small Cap Fund: On an improving performance trajectory versus benchmark and peers

Union Mutual Fund, sponsored by Union Bank of India and Dai-ichi Life Holdings, Inc., aims to be a reliable and trusted partner to investors and distributors through responsible investing. With a focus on long-term wealth creation, the fund house seeks to support investors across towns and cities in their journey towards financial freedom. Its investment approach emphasizes managing credit risk through careful selection of securities and maintaining portfolios that are true to mandate. The core values of Trust, Transparency, and Consistency of Performance guide its overall philosophy.
Investor Centre


About Union MF
POST A QUERY