
How to calculate indicative returns from Mutual Fund FMP NFOs

In a previous article we had discussed that, in the last one year top performing Mutual Fund Fixed Maturity Plans have given better returns than bank fixed deposits even on a pre tax basis. On a post tax basis, FMP returns are even better than FDs because while FDs are taxed at the applicable income tax slab rate of the tax payer, FMPs are subject to capital gains tax at 10.3% without indexation benefit and 20.6% with indexation benefit. However, bank fixed deposits are more popular than FMPs because while banks can tell investors how much interest they will pay, investors in FMPs have little clarity on how much returns they will generate.
In this article, we will discuss how investors can calculate estimated return from FMP new fund offer (NFO), so that they can compare the returns with the fixed deposits and other short term debt investments, before making an investment decision. SEBI now allows close-ended debt schemes to disclose instruments in which they propose to invest as well as floors and ceilings within 5 per cent range of the intended allocation. This information, available in the scheme information document or offer document of the new funds offering (NFO), can help investors get more clarity on the returns they can expect from the FMPs.
Fixed maturity plans are close ended schemes that aim to generate income for the investors in a fixed term, by investing in debt securities such as treasury bills (T-bills), commercial papers (CPs), certificates of deposit (CDs), government and corporate bonds. FMPs are open for subscription for a limited period. Investors cannot redeem FMP units before maturity. While investors can sell FMPs on stock exchanges, the liquidity of FMPs before maturity is quite low. As such investors should buy FMP units with a view of holding them till maturity.
Before we discuss how to calculate expected returns from FMPs, let us briefly review the different types of debt instruments that the FMPs invest in.
Government Securities (G-Secs):
These are debt instruments issued by the RBI on behalf of Government of India. There are both short term and long term instruments. The short term instruments, also known as Treasury Bills, have maturities of 91, 182 and 364 days. The long terms G-Secs have maturities ranging from 1 to 30 years, and offer fixed interest rates. Government securities have zero credit riskCorporate Bonds or Debentures:
These are issued by private and public sector companies. These instruments carry credit risks and are rated by the rating agencies like CRISIL, ICRA etc. Higher the credit risk, higher is the interest paid by the bond issuer.Certificate of Deposits (CDs):
CDs are money market instruments, issued by banks and financial institutions for maturity periods ranging from 7 days to 3 yearsCommercial Paper (CPs):
CPs are also money market instruments, issued by corporate entities for maturity periods ranging from 7 days to 365 days.
While these instruments have various maturity periods, fund managers of FMPs try to match the maturities of their debt instruments with the maturity of the scheme, so that they can minimize re-investment risks. FMP offer document should clearly articulate the instruments (described above), in which the scheme plans to invest and in what proportion within a 5% range of intended allocation. The offer document should also mention the credit quality (e.g. A1, AAA, AA etc.) of the instrument and expected yields. It must be mentioned here that, the details provided in the offer document, differs from AMC to AMC, but most reputed AMCs provide enough details to enable the investors to calculate expected returns. In this article, we will how to calculate the expected yield of a FMP with a few examples using the information available in some upcoming NFO offer documents. Please note that the estimated are only indicative. The actual return will depend upon the actual allocation to the various instruments and the actual yields.
Example 1: Tata Fixed Maturity Plan Series 47 Scheme E
- Fund Launch Date: 03/04/2014
- Fund Closure Date: 09/04/2014
- Maturity: 371 days
- Indicative portfolio (see the offer document)
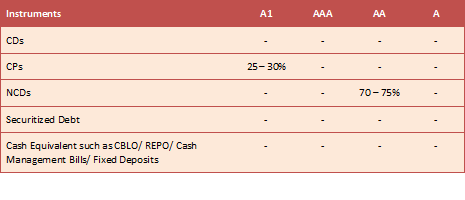
- Expected Yields (see the offer document)

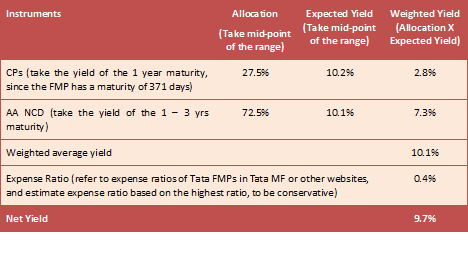
- Calculation of expected returns
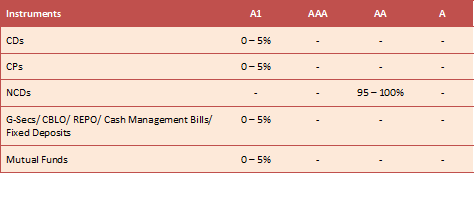
Example 2: Birla Sun Life Fixed Term Plan - Series LA (366 days)
- Fund Launch Date: 04/04/2014
- Fund Closure Date: 07/04/2014
- Maturity: 366 days
- Indicative portfolio (please see the offer document)
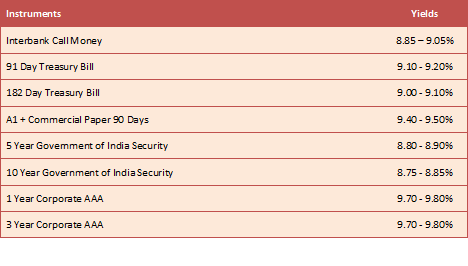
- Expected Yields (see the offer document)
- Calculation of expected returns
We need to make some assumptions here.
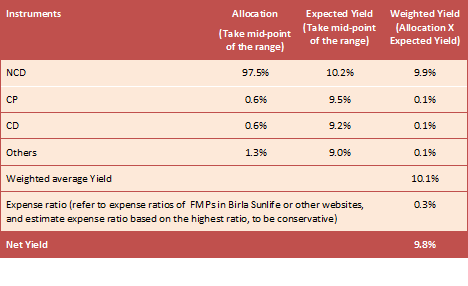
1 - Allocation: Since the largest allocation is to NCDs, let us assume the average of the range 95 – 100% which is 97.5% is allocated to NCDs. Let us the assume the balance 2.5% is equally allocated to CDs, CPs, G-Secs/ CBLO/ REPO/ Cash Management Bills/ Fixed Deposits and mutual funds, at 0.625% each.
2 - Since the offer document does not provide the AA bond / NCD yield, we have to make an intelligent estimation of the yield. Analysis of bond yields (available in business dailies and financial websites) will show that spread between yields of AA and AAA of same maturities, is 30 to 40 basis points (0.3 – 0.4%). In order to estimate the yield of 1 year AA rated corporate bond or NCD, we should add 0.4% to the yield of AAA rated corporate bond or NCD. Therefore, the yield of the AA rated corporate bond can be estimated to be 10.1 – 10.2%
3 - Since the offer document, does not provide CD yield, we have to make an estimation of the yield. Analysis of CP and CD yields (available in business dailies and financial websites) will show that spread between CD and CP yields (of same maturities) is 30 basis points (0.3%). Therefore the CD yield can be estimated to be 9.1 – 9.2%
4 - Since we do not know the exact nature of instruments included in the category G-Secs/ CBLO/ REPO/ Cash Management Bills/ Fixed Deposits and mutual funds, let us be conservative and assume the expected yield is the same as call money rate, 8.85 – 9.05%. It really does not make a big difference to the final yield of the FMP, because the allocation to these instruments is only about 1.2%.
Once we have made these assumptions, which are fairly straightforward, we can calculate the expected returns of the FMP.
Conclusion
In this article, we have discussed how to calculate with a certain level of confidence, the estimated returns from a Fixed Maturity using the information available in the offer document. We went through two examples, one (Tata) in which most of the information is available in offer document, and another (Birla Sunlife) in which the investor had to make some reasonable assumptions. Further, FMP investors should remember that FMPs are more tax efficient than other debt investments (please refer to our article, Top performing FMPs have given better returns than Bank FDs, for calculating capital gains with indexation). FMP investors need not go into their investments blind, or discard it straightaway because they do not have clarity of returns, compared to FDs which give assured returns. While the estimated returns are only indicative, it gives the investor a sense of how much returns can be expected from FMPs, especially compared to fixed deposit interest rates.


Queries
-
What is the benefit of mutual fund STP
Aug 29, 2019
-
How much to invest to meet target amount of Rs 2 Crores
Aug 26, 2019
-
Can I achieve my financial goals with my current mutual fund investments
Aug 24, 2019
-
Can you tell me return of various indices
Aug 19, 2019
-
What would be the post tax return on different investments
Aug 18, 2019
-
Which Principal Mutual Fund scheme will be suitable for my retirement corpus
Aug 16, 2019
-
What is the minimum holding period for availing NCD interest
Aug 4, 2019
Top Performing Mutual Funds

Recommended Reading


Fund News
-
Motilal Oswal Mutual Fund launches Motilal Oswal Nifty Metal ETF
Aug 3, 2026 by Advisorkhoj Team
-
Motilal Oswal Mutual Fund launches Motilal Oswal Nifty Oil and Gas ETF
Aug 3, 2026 by Advisorkhoj Team
-
Kotak Mahindra Mutual Fund launches Kotak Nifty Bank Index Fund
Aug 3, 2026 by Advisorkhoj Team
-
Invesco Mutual Fund launches Invesco India Nifty Bank ETF
Jul 28, 2026 by Advisorkhoj Team
-
Invesco Mutual Fund launches Invesco India BSE Sensex ETF
Jul 28, 2026 by Advisorkhoj Team


