UTI Flexi Cap Fund: Outstanding track record of wealth creation

UTI Flexi Cap Fund, with more than 34 years of history, has established a strong track record of creating long-term wealth for investors. Flexicap funds can invest dynamically across market cap segments. There are no market cap segment wise limits for flexicap funds. As per AMFI July data, flexicap funds have the highest AUM among all active equity fund categories (source: AMFI, as on 31st July 2026) making the one of the most popular mutual categories among retail investors. In this article, we will review UTI Flexi Cap Fund.
Wealth creation track record
The chart below shows the growth of Rs 1 lakh investment in UTI Flexi Cap Fund over the last 20 years. Your wealth would have multiplied 11X over this period. You can also see that the fund outperformed the benchmark index, Nifty 500 TRI.
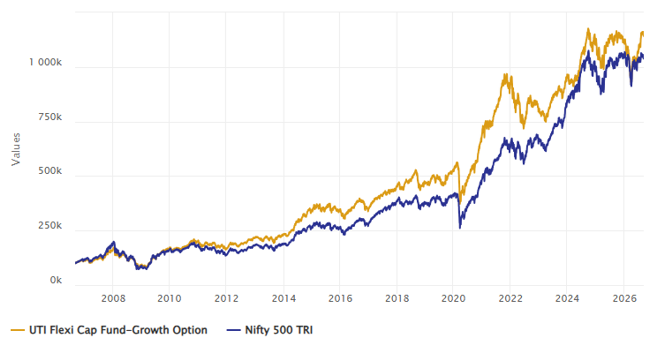
Source: Advisorkhoj Research, as on 31st August 2026
Outperformed benchmark index over longer investment tenures across market conditions
The chart below shows the 5 year rolling returns of the UTI Flexi Cap Fund versus the benchmark index over the last 20 years. You can see the scheme outperformed benchmark index over 5 year tenures across different market conditions, most of the times.
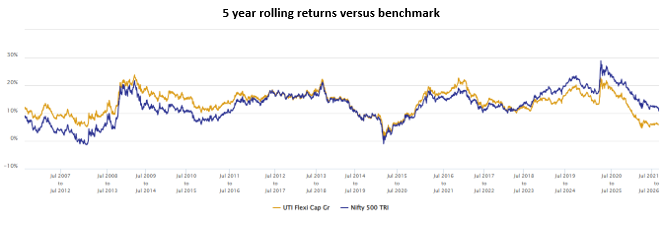
Source: Advisorkhoj Research, as on 31st August 2026
The table below shows the rolling returns distribution of UTI Flexi Cap Fund versus the benchmark index for different investment tenures over the last 20 years. You can see that scheme had higher percentage instances of 12%+ CAGR returns for different investment tenures (e.g. 5 years, 7 years, 10 years etc) compared to the benchmark index, in other words, superior performance consistency vis a vis the benchmark index.
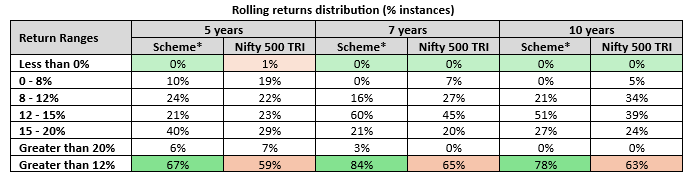
Source: Advisorkhoj Research, as on 21st August 2026. *Scheme – UTI Flexi Cap Fund
Outperformed peer average over longer investment tenures across market conditions
The chart below shows the 5 year rolling returns of the UTI Flexi Cap Fund versus the flexi cap category average over the last 20 years. You can see the scheme outperformed peer average over 5 year tenures across different market conditions, most of the times.
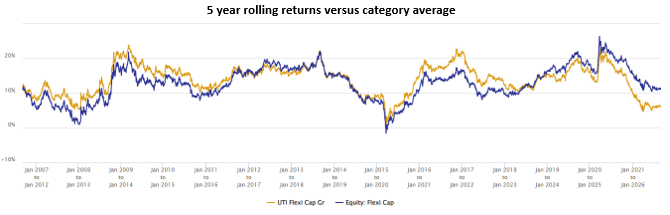
Source: NSE, Advisorkhoj Research, as on 31st August 2026
The table below shows the rolling returns distribution of UTI Flexi Cap Fund versus the flexi cap category average index for different investment tenures over the last 20 years. You can see that scheme had higher percentage instances of 12%+ CAGR returns for different investment tenures (e.g. 5 years, 7 years, 10 years etc) compared to category average, in other words, superior performance consistency vis a vis the average peer group.
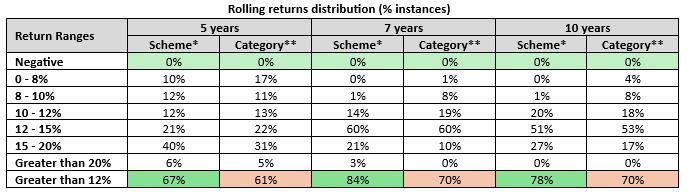
Source: Advisorkhoj Research, as on 31st August 2026. *Scheme – UTI Flexi Cap Fund. **- Flexi Cap funds category average
Relatively lower downside risk versus the benchmark
The chart below shows the drawdowns of UTI Flexi Cap Fund versus the benchmark index over the last 20 years. You can see that in most market corrections UTI Flexi Cap Fund was able to limit downside risks for investors. The maximum drawdown of the scheme was 52%, while the maximum drawdown of the benchmark was 64%
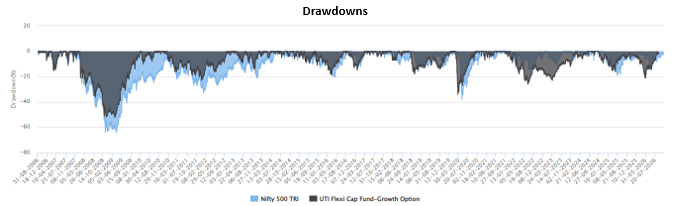
Source: NSE, Advisorkhoj Research, as on 31st August 2026
The table below shows the major drawdowns of the UTI Flexi Cap Fund versus the benchmark index over the last 20 years. You can see that in most major market corrections, UTI Flexi Cap Fund experienced smaller drawdowns compared to the benchmark.
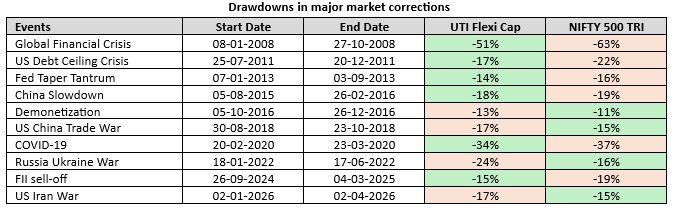
Source: NSE, Advisorkhoj Research, as on 31st August 2026
Wealth creation through SIP
The chart below shows the growth of Rs 10,000 monthly SIP in UTI Flexi Cap Fund since the inception of the scheme. You can see that with a cumulative investment of just over Rs 24 lakhs, you could have accumulated a corpus of over Rs 1 crore.
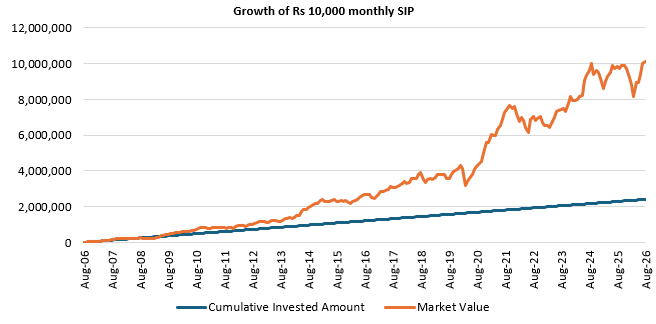
Source: Advisorkhoj Research, as on 31st August 2026
The chart below shows the 10 year rolling SIP XIRR of the UTI Flexi Cap Fund Over the last 20 years. You can see that the scheme gave double digit XIRR returns most of the times (94% of instances) over 10 year SIP tenures.
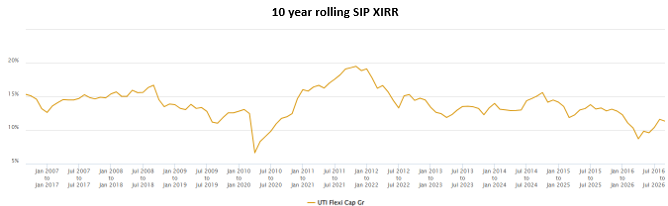
Source: Advisorkhoj Research, as on 31st August 2026
The table below shows the rolling SIP XIRR distribution of UTI Flexi Cap Fund versus the benchmark index for different SIP tenures over the last 20 years. You can see that scheme had higher percentage instances of 12%+ CAGR returns for different investment tenures (e.g. 5 years, 7 years, 10 years etc) compared to the benchmark index, in other words, superior performance consistency vis a vis the benchmark index. For 10+ years SIP tenures, the percentage instances of 12%+ SIP XIRR was over 80%.
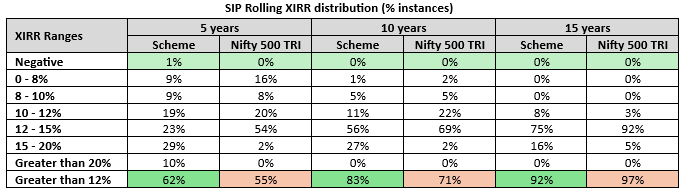
Source: Advisorkhoj Research, as on 31st August 2026
Investment philosophy
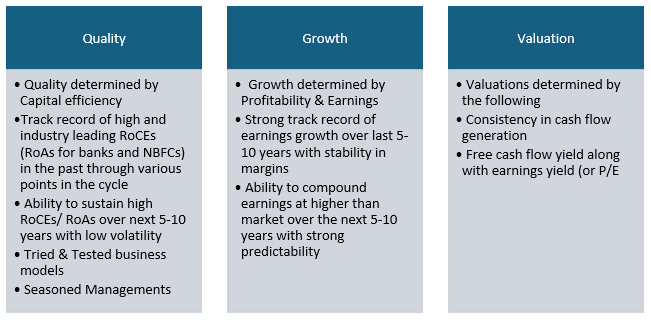
Investment Strategy
- Bottom-up philosophy with focus on microeconomics of the businesses that are part of the portfolio rather than on the global/ local macro factors
- Long term investment focus with very low portfolio turnover
- Look to invest in companies that can use market slowdown to strengthen their competitive positioning
- Avoid market timing in terms of cash, sector or stock calls
- Open to take big sectoral underweight or overweight positions if longer term drivers are absent/ favourable
- Emphasis on selection of mid and small cap stocks as they are the potential alpha generators of the fund
- Portfolio designed with an aim to survive the market upheavals and ride the upside when recovery comes; avoid risks which could lead to permanent loss of capital
Current portfolio positioning
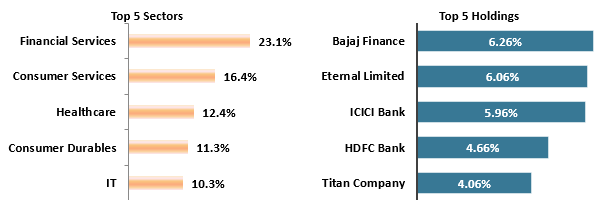
Source: UTI MF, as on 31st July 2026
Who can find UTI Flexi Cap Fund suitable?
- The fund can form the core part of an investor’s equity portfolio.
- Investors with long term investment horizon i.e., 5 years or more.
- Investors with very high-risk appetite who can tolerate the short-term volatility associated with equity investments.
- The fund is suitable for investors who want to invest from their monthly savings through SIP for their long-term financial goals like children’s higher education, marriage, retirement planning, wealth creation, etc.
- Investors who wish to avoid the complexities of determining allocation among large, mid, and small-cap stocks independently.
Consult a mutual fund distributor or your financial advisor to understand if the UTI Flexi Cap Fund is suited to your investor profile.
Mutual Fund Investments are subject to market risk, read all scheme related documents carefully.




Queries
-
What is the benefit of mutual fund STP
Aug 29, 2019
-
How much to invest to meet target amount of Rs 2 Crores
Aug 26, 2019
-
Can I achieve my financial goals with my current mutual fund investments
Aug 24, 2019
-
Can you tell me return of various indices
Aug 19, 2019
-
What would be the post tax return on different investments
Aug 18, 2019
-
Which Principal Mutual Fund scheme will be suitable for my retirement corpus
Aug 16, 2019
-
What is the minimum holding period for availing NCD interest
Aug 4, 2019
Top Performing Mutual Funds

Recommended Reading




Fund News
-
Samco Mutual Fund launches Samco Equity Savings Fund
Oct 19, 2026 by Advisorkhoj Team
-
Navi Mutual Fund launches Navi Mutli Asset Omni FoF
Oct 19, 2026 by Advisorkhoj Team
-
Carnelian Mutual Fund launches Carnelian Small Cap Fund
Oct 16, 2026 by Advisorkhoj Team
-
Axis Mutual Fund launches Axis Nifty EV and New Age Automotive Index Fund
Oct 16, 2026 by Advisorkhoj Team
-
AlphaGrep Mutual Fund SIF launches Eminence Hybrid Long Short Fund
Oct 15, 2026 by Advisorkhoj Team