
How Investing in Equities for the long term reduces risk

You would have read about the virtues of long term investing over and over again, not just on our website but in numerous other places too. The logic is fairly simple. The longer you stay invested in an asset you get more returns from the asset. If your 8% fixed deposit term is one year, you get 8% returns. On the other hand if your 8% fixed deposit term is 5 years, you get 47% returns. The same logic applies to equities or equity oriented mutual funds also. However, the most important characteristic of equity as an asset class is risk. Many of you are aware that risk and return are directly related; higher the risk, higher the return and vice versa. However, most investors, especially retail investors dread risk and quite understandably so. How can you reduce your risk? Mutual funds reduce the unsystematic risk (company risk and sector risk) to a large extent through diversification, but they are still exposed to systematic risk or market risk. What is market risk? Market risk is essentially the volatility of the equity market itself. The market moves up and down in an unpredictable way and volatility is a measure of this unpredictability. Many investors have told me that they do not like volatility.
As an investor, I am personally quite indifferent to volatility (unless I am trading in options, but that is a different topic), but what I do not like, is losses. You should ask yourself, which is the one you really fear - Volatility or losses? In finance text books volatility is used interchangeably with risk, actually as a measure of risk. But as an investor you should understand that, volatility and losses is not the same thing. There is a relationship between volatility and losses; the probability of making a loss is higher with higher volatility, but you do not make a loss until you sell. This is an important distinction that you should understand in equity investments. When you buy and sell, determines your investment tenure. In this blog post we will examine the relationship between investment tenure and risk. A few years back, I was chatting with a college friend, who is a fund manager with a renowned mutual fund house in India. He told me that, the risk goes down with longer investment tenures. In our blog, we always try to be data driven and analytical. Let us see, if the data analytics validate what my friend was telling me.
For our analysis, we will use the BSE Sensex as the proxy for the market. We will analyze annualized Sensex returns from 1990 to 2015. The period in our analysis is a long 25 year period, covering several market cycles, both bull markets and bear markets. Therefore, there should be any market cycle related bias in our analysis. The chart below shows the annual closing values of the Sensex from 1990 to 2015.
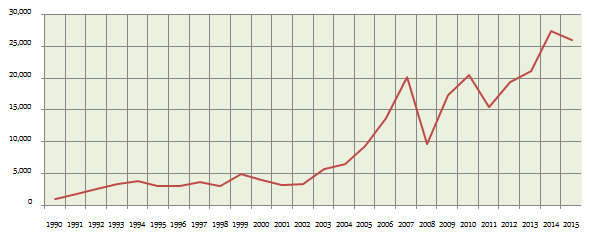
Source: Bombay Stock Exchange
Today the Sensex is around 25,000. It is hard to imagine that in 1990 the Sensex was around 1,000 only. The Sensex has become 25 times in the last 25 years. It is a nice little symmetry of numbers to show that our equity market has come such a long way, but what we are really analyzing is the annual returns of the Sensex. The chart below shows the annual returns of the Sensex from 1990 to 2015.
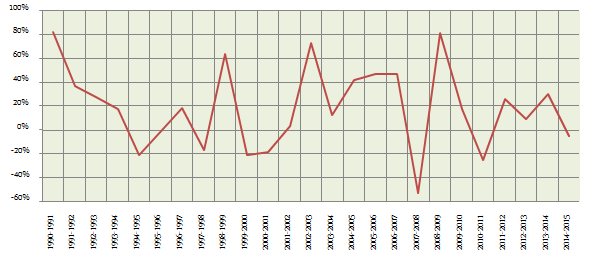
The highest annual return of the Sensex was 80%, but the lowest annual return is -60% losses (in 2008). What the chart above tells you, is something that we already know, that equity markets are volatile. The average annual return of the Sensex over the last 25 years is 19%. But what was the volatility of the Sensex? Volatility or risk is usually measured by standard deviation of returns. The volatility of the Sensex was 35%. What does the standard deviation or volatility percentage tells us? It is a slightly complicated concept. For more mathematically oriented readers, all possible returns of Sensex can be mapped to a curve, known as bell curve or in the language of statistics as the normal distribution.
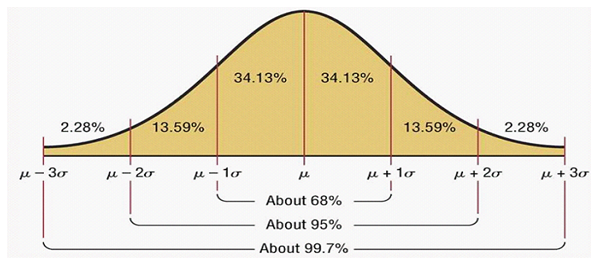
The horizontal axis represents the possible returns given by Sensex. In the chart above, µ is nothing but the average and ? is the standard deviation (SD). Since the average annual return of the Sensex over the last 25 years is 19% and the standard deviation is 35%. We can see from the chart above that there was nearly 16% (13.59% + 2.28%) chance of making a -16% (19% - 35%) loss. Normal distribution table tells us that, based on 19% average returns and 35% standard deviation there is 30% chance of not recovering your capital if you have an one year investment tenure. Readers who want a more comprehensive mathematical understanding of risk in equity investing can read our article, How to interpret risk in equity investment for effective financial planning. However, for readers who are not mathematically inclined, if you understand that standard deviation is simply a measure of risk, it more than serves the purpose. What we should reiterate, however, is that risk or volatility is not the same as losses.
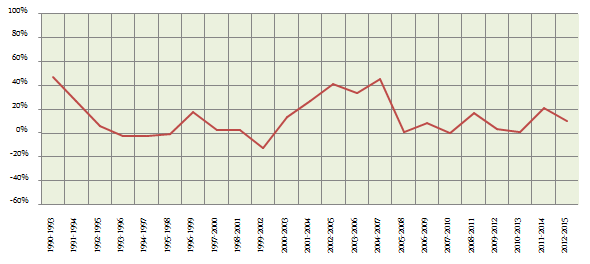
Let us now see the returns Sensex would have given you, if you had 2 year investment horizon instead of 1 and more importantly the risk with a 2 year investment horizon. For this analysis we will look at 2 year annualized rolling returns of the Sensex since 1990.
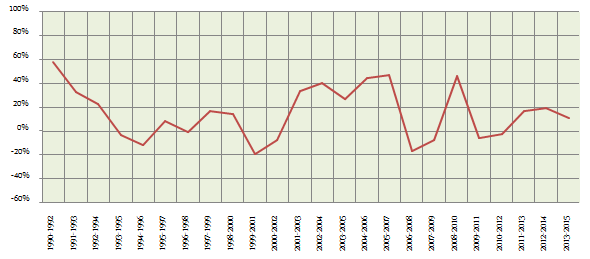
Compare this chart with the previous annual return chart. Is this graph not a little smoother than the annual return graph? The maximum annualized loss is 20%. Over a 2 year investment horizon it means that the maximum total loss would have been about 36%, compared to 60% with 1 year investment horizon. The average annualized 2 year rolling return of the Sensex over the last 25 years is 15% (compared to 19% average annual returns). What is the risk with a two year investment horizon? The shape of the graph itself tells you that the volatility of risk is lower. The standard deviation of 2 year rolling returns of the Sensex is only 22%. Compare this with the standard deviation of the annual returns (35%). Clearly with a two year investment horizon, you are reducing a lot of risk.
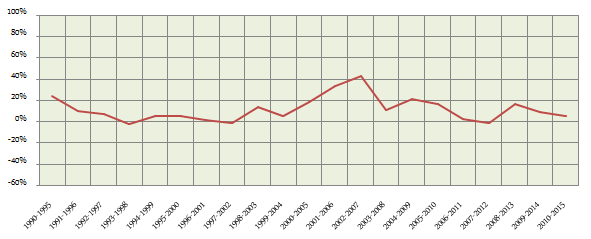
Let us now see the returns Sensex would have given you if you had 3 year investment horizon and also the risk with a 3 year investment horizon. For this analysis we will look at 3 year annualized rolling returns of the Sensex since 1990.
You can see that the graph is much smoother. You can see that the graph has dipped zero only in 3 periods in the last 25 years (compared to the 8 periods in annual returns chart). The standard deviation or volatility with 3 year investment tenure is 17% (compared to 35% with one year investment tenure). You can see that the risk is going down as investment tenures get longer.
Let us now see the returns Sensex would have given you if you had a 5 year investment tenure. For this analysis we will look at 5 year annualized rolling returns of the Sensex since 1990.
Compare this chart with the previous rolling return charts. From the chart itself, it is clear that the probability of making losses is much lower. The standard deviation of 5 year rolling returns tells us the same thing. The standard deviation of 5 year rolling returns of the Sensex is 12%.
Let us now see the returns Sensex would have given you if you had 7 year investment tenure. For this analysis we will look at 7 year annualized rolling returns of the Sensex since 1990.
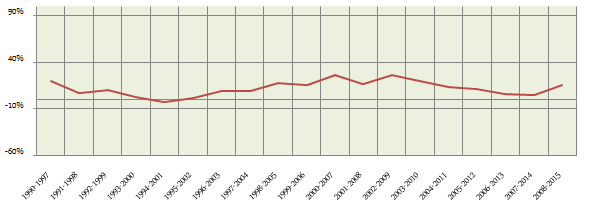
As expected the graph is smoother and the risk lower. The standard deviation of 7 year rolling returns of the Sensex is 8%.
Let us now see the returns Sensex would have given you if you had 10 year investment tenure. For this analysis we will look at 10 year annualized rolling returns of the Sensex since 1990.
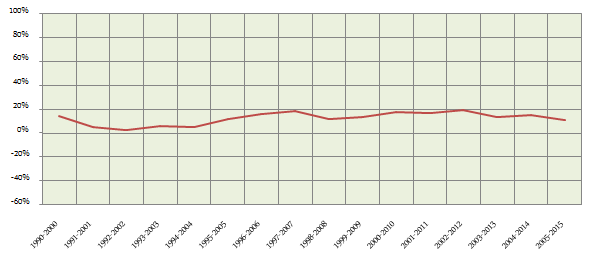
You can see that, the rolling returns were never negative and were much significantly higher than the inflation rate most of the time. The standard deviation of 10 year rolling returns of the Sensex is only 5%.
Finally, let us now see the returns Sensex would have given you if you had 15 year investment tenure. For this analysis we will look at 15 year annualized rolling returns of the Sensex since 1990.
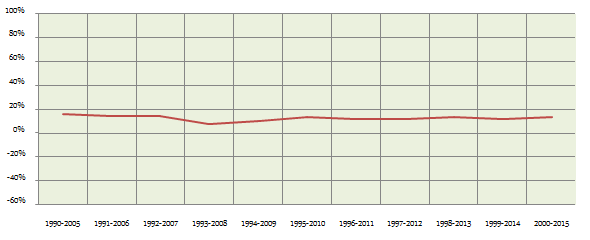
See how smooth the graph is. Based on this chart, I am tempted to say that the rolling returns over a 15 year investment period is almost predictable but I will not, because it is incorrect to say that equity market is predictable. But the data tells us one thing for sure - The risk is much lower. The standard deviation of 15 year rolling returns of the Sensex is only 2%.
To understand what 2% standard deviation of Sensex 15 years rolling returns really means for the investor, apart from the obvious fact that the risk is very low, let us quantify the loss probability. Fortunately or unfortunately we have to go back to the bell curve (normal distribution). Before we go there, please not that the average annualized 15 rolling returns of the Sensex over the last 25 years was 13%. 13% average returns and 2% standard deviation means that you make a loss only when the return is less than 6.5 standard deviations from the average returns. Investors who work in the manufacturing, technology and technology enabled sectors among others would be able to understand, the huge importance of 6.5 standard deviations from average. It is 6-sigma; which in manufacturing parlance means, zero defects. To translate this for readers who are not familiar with 6-sigma, it means that if you have a 15 year investment horizon the probability of loss is effectively zero.
While, 6-sigma with respect to capital protection is comforting, I, as an investor, am more interested in whether Sensex could give more than risk free returns, if I have 15 year investment horizon. At the end of the day, if I was only concerned about protection, then I had multiple avenues of earning risk free returns. Therefore, what I am interested in knowing is that, if I am taking a risk with equities and have a long investment horizon, what is probability of earning more than risk free returns?
Over the last nearly 20 years the average 10 year Government Bond yield has been about 8.2%. The 10 year Government Bond yield is usually taken as the risk free rate. What is the probability that Sensex would give more than the risk free rate, if I had a 15 year investment horizon? Recall the average annualized 15 year rolling return of the Sensex was 13% and the standard deviation of 15 year rolling return was 2%. If you refer to the bell curve or normal distribution curve, the probability of getting more than risk free returns is 97%. Now, is not that interesting? Remember every extra percentage of return that you get, grows your wealth exponentially over a long investment horizon, through the power of compounding.
Conclusion
In this post, we have discussed the risk of the Sensex returns for different investment tenures over the last 25 years. Let us recap the volatilities (standard deviations) of Sensex rolling returns over different investment tenures in the last 25 years.
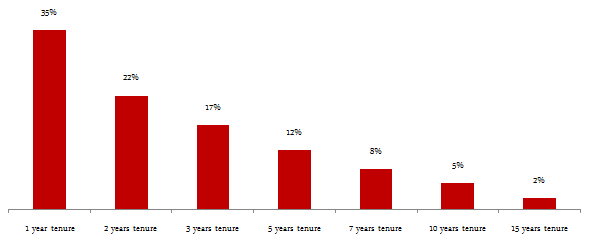
We have observed that the volatility or risk goes down as the investment tenure gets longer. The observations are consistent across investment tenures and this validates what my fund manager friend told me. The risk of equity investment goes down with investment tenures. Your investment tenure should be determined by your financial plan and not what the market is doing. We have crunched a lot of data in this analysis, but all this data crunching essentially reinforces the two age old virtues involved in equity investing, patience and discipline.
RECOMMENDED READS
LATEST ARTICLES
- Why you need to have hybrid mutual funds in your portfolio: Different types of funds Part 2
- Why you need to have hybrid mutual funds in your portfolio: Misconceptions Part 1
- Which is the best time to invest in mutual funds
- Economic slowdown: Is it real and what should you do
- Importance of liquidity in investing: Mutual funds are ideal solutions

An Investor Education Initiative by ICICI Prudential Mutual Fund to help you make informed investment decisions.
Quick Links
Follow ICICI Pru MF
More About ICICI Pru MF
POST A QUERY


