
How to interpret risk in equity investment for effective financial planning

We know that equities give the highest long term returns among all asset classes. We also know that there is risk associated with equity investment, which implies that there is no certainty of returns or even the safety of the investor’s capital in equity investing. It is this element of unpredictability, that makes investors hesitate to invest in equities. For most retail investors, risk is really a subjective notion related to the loss of capital. Retail investors are often influenced by, what is known in psychological terms as negativity bias, by which they recall bad memories more easily and in greater detail than good ones. This leads to an irrational fear of losses and ultra-conservative approach to asset allocation. On the other hand, if investors take an objective view of risks, then they can take effective financial planning decisions and achieve optimal asset allocation that can help them meet their financial planning goals, since underexposure to equities will most likely compromise the long term goals of the investor.
What is the objective measure of risk?
Risk is deviation from the expected investment returns of the investor. Theoretically, there are two kinds of risk:-
- Upside risk: Upside risk is the likelihood of gains. In reality, it is not really a risk because it is beneficial for the investor
- Downside risk: Downside risk is the likelihood of losses. It is this risk that the investor is worried about. In this article, we will focus primarily on downside risk
What is the downside risk in Indian equities? In 2008 the Sensex crashed 60%. So, is the downside risk of Indian equities 60%? No. 2008 was really the worst case scenario for equity investors. It was a rare event in the history of Indian and global equities. Instead of base-lining downside risks to one off events, we will define an objective measure of risk, using statistical measures. The statistical measure used to measure risk or volatility of equity investment is called standard deviation.
Standard Deviation is a measure of volatility and measures the deviations from the average return on investment. We know that higher the standard deviation, higher the risk. In this article, we will try to understand in greater details what the standard deviation number really means. We will try to understand using 10 year BSE Sensex data, from May 2004 to May 2014. Please see below, the 10 year daily closing price chart of Sensex from May 16 2004 to May 16 2014.
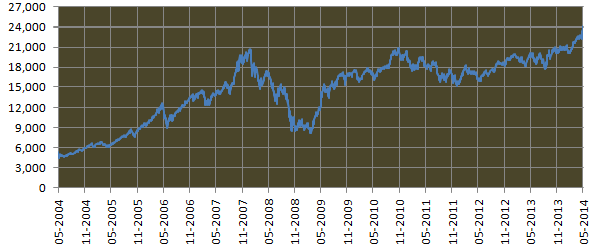
We can see from the chart above that during this period the Sensex rose from 4,500 to 24,000 levels. During the same period, the Sensex also went through very sharp corrections, including the 60% crash in 2008. Overall Sensex gave an average annualized of 18.3% during this period. As a measure of risk, the annualized standard deviation of monthly returns during this period was 26.5%. What does standard deviation of 26.5% really mean? To get an understanding of what this means, we have to understand the likelihood or probability of the downside risk.
Framework of risk and probability
To understand the likelihood or probability of the downside risk, we need to plot the probability distribution of the Sensex returns, based on the 10 year Sensex data. Probability distribution is nothing but the probability or likelihood of all possible returns from the Sensex. For example, the probability distribution will tell us the probability of getting more than 40% annual returns from the Sensex. Equity returns follow a probability distribution called Normal or Gaussian distribution, in which most of possible returns are clustered around the average return and then tails of symmetrically from the average. The shape of the distribution is therefore like a bell and this distribution is more popularly known as the bell curve. Please see below the normal distribution or bell curve of the Sensex annualized returns.
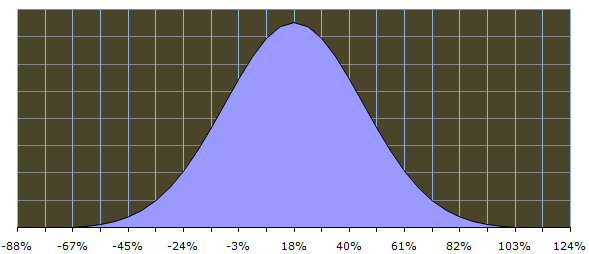
The horizontal axis shows the all possible returns from the Sensex. The blue area, in shape of a bell, is the probability of the return. The total blue area represents a probability of 100%, i.e. all possible outcomes. You can see that the central point of the horizontal axis is 18%, which the average annualized returns from the Sensex over the 10 year period.
How do we interpret this chart? The area of the curve to the right of a particular return will give us the probability of exceeding that return. For example, the area of the curve to the right of the 18% return on the horizontal axis is 50% (no surprises because 18% is the average or mid-point). So, the probability that Sensex returns will exceed 18% is 50%. What is the probability that Sensex returns will exceed 40%? The area of the curve to the right of 40% return on the horizontal axis is 16%. So the probability that Sensex returns will exceed 40% is 16%. Let us take another example. What is the probability that Sensex returns will exceed 65%? The area of the curve to the right of 65% return on the horizontal axis is 2%. So the probability that Sensex returns will exceed 65% is only 2%.
Just like the area of the curve to the right of a particular return gives us the probability of exceeding that return, the area of the curve to the left of a particular return gives us the probability of getting lower returns. So, the probability that Sensex returns will be lower than 18% is 50% (no surprises because 18% is the average or mid-point). What is the probability that Sensex returns will be lower than -3%? The area of the curve to the left of -3% returns on the horizontal axis is 15%. So the probability that Sensex returns will be lower than -3% is 15%. What is the probability that Sensex returns will be lower than -24%? The area of the curve to the left of -24% returns on the horizontal axis is 2%. So the probability that Sensex returns will be lower than -2% is only.
We have seen how we can conceptually get a sense of the probability of returns from the normal distribution or bell curve. However, it is difficult to estimate probabilities by a visual examination of the curve. This is where standard deviation comes in. Standard deviations will help us in knowing the probability of a getting a higher or lower return. Since we are worried only about downside risks, we will focus on the left side of the bell curve (right side is just a mirror image of the left side). Here is how we can use standard deviation to estimate probabilities.
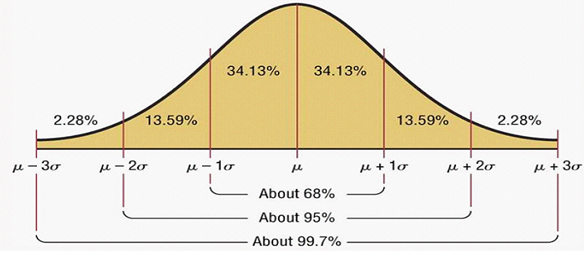
In the chart above, µ is nothing but the average and σ is the standard deviation (SD). Let us explain the bell curve in a tabular format. The probability of the returns on the downside is as follows:-
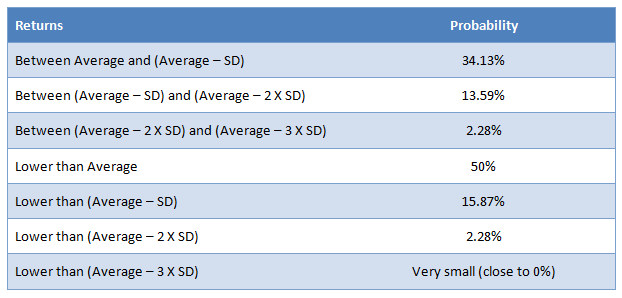
Now that we have framework of risk and probability, let us examine the downside risk of Sensex based on the last 10 years data. We must mention here that 10 years data is a sufficiently large sample and therefore is fairly representative. The average annualized 10 year returns was 18.3% and the standard deviation during this period was 26.5%. Therefore an investor can expect long term annualized returns of around 18% from the Sensex. But what is his or her downside risk? The table below shows the probability of downside risks in Sensex.
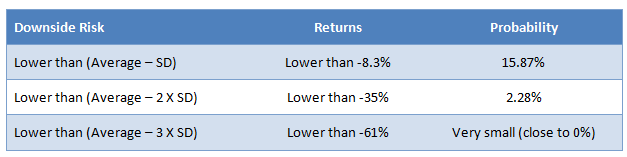
From the table above, we can see that, while the expected return for the investor is 18%, the probability of the investor losing more than 8% of his or her money is around only 16%. The probability of losing more than 35% of his or her money is only 2%. This can help the investor do an objective evaluation of risk and make effective asset allocation decisions.
Risk in context of mutual funds
The concept of risk or standard deviation in mutual funds is exactly the same as equities. Mutual fund research sites like Morningstar and Value Research publish the annualized returns and standard deviation for each equity mutual fund. By using the same method as above, you can get the probability of downside risks in mutual funds.
Conclusion
Equity prices move up and down. It is not possible to predict returns, but it is possible to assign probabilities to potential outcomes, in terms of returns. Our biggest fear in investing is the fear of losing money. But if you evaluate downside risks and the associated probabilities, then you can make effective asset allocation decisions. In the example above, is the investor comfortable with a 16% probability of losing his money? If yes, then he should invest in equities. If the investor is not comfortable with 16% probability of losing money, but he is comfortable with a 10% probability, then he needs to add some debt investments to his portfolio. An objective understanding of risk, thus plays an important role in an effective financial planning.


Queries
-
What is the benefit of mutual fund STP
Aug 29, 2019
-
How much to invest to meet target amount of Rs 2 Crores
Aug 26, 2019
-
Can I achieve my financial goals with my current mutual fund investments
Aug 24, 2019
-
Can you tell me return of various indices
Aug 19, 2019
-
What would be the post tax return on different investments
Aug 18, 2019
-
Which Principal Mutual Fund scheme will be suitable for my retirement corpus
Aug 16, 2019
-
What is the minimum holding period for availing NCD interest
Aug 4, 2019
Top Performing Mutual Funds

Recommended Reading


Fund News
-
Abakkus Mutual Fund launches Abakkus Large and Mid Cap Fund
Jul 15, 2026 by Advisorkhoj Team
-
The Wealth Company Mutual Fund launches The Wealth Company Mid Cap Fund
Jul 15, 2026 by Advisorkhoj Team
-
Baroda BNP Paribas Mutual Fund launches Baroda BNP Paribas Services Fund
Jul 14, 2026 by Advisorkhoj Team
-
Bajaj Finserv Mutual Fund launches Bajaj Finserv BSE Top 10 Banks ETF
Jul 13, 2026 by Advisorkhoj Team
-
Quantum Mutual Fund Appoints Manish Sharma as Head of Sales
Jul 10, 2026 by Quantum Mutual Fund


