Motilal Oswal BSE Midcap 150 Momentum 30 Index Fund Review (2026): NFO, Benefits, Returns & Should You Invest?

Learn everything about the Motilal Oswal BSE Midcap 150 Momentum 30 Index Fund NFO, momentum investing, portfolio strategy, benefits, risks, and who should invest.
Key Takeaways
- New Fund Offer (NFO): 3 July-17 July 2026
- Tracks the BSE Midcap 150 Momentum 30 Index
- Invests in 30 high-momentum midcap stocks
- Passive index fund
- Suitable for long-term investors (3-5 years+)
- High-risk, high-growth strategy
The Motilal Oswal Mutual Fund has launched its NFO, the Motilal Oswal BSE Midcap 150 Momentum 30 Index Fund. As the scheme name suggests, the fund will track the BSE Midcap 150 Momentum 30 Index. Funds tracking factor indices, also known as smart beta funds, are increasingly popular with investors, as they have the potential to outperform broad market indices, e.g., Nifty, Sensex. The NFO has opened for subscription on 3rd July 2026 and will close on 17th July 2026. In this article, we will review the Motilal Oswal BSE Midcap 150 Momentum 30 Index Fund.
What is momentum?
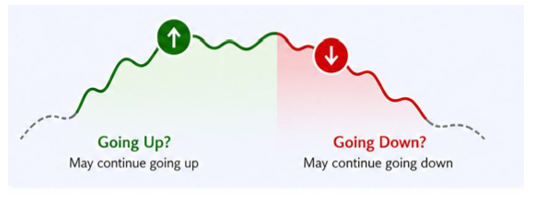
Momentum, in the context of equity markets, refers to the tendency of stock price trends to persist. In very simple terms it means that prices follow a trend - if stock prices are rising, it may rise further, and if stock prices are falling, they may fall further. Investors are generally drawn to stocks experiencing an upward trajectory, thus creating the potential of "buying high and selling higher" instead of the traditional "buy low and sell high" to generate higher returns.
Source: MOSL Product presentation
How does momentum investing work?
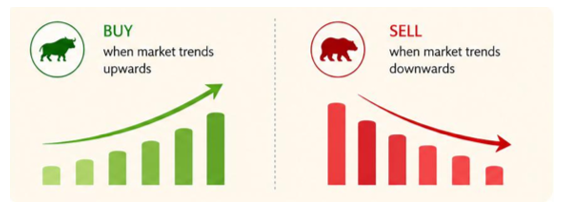
- The momentum strategy invests in stocks that are outperforming and reduces exposure to stocks that are underperforming.
Source: MOSL Product presentation
- It is based on the premise that stocks that have performed well in the recent past are likely to continue doing so.
- The strategy picks a stock after it has moved and proven its strength.
- The strategy exits a stock not at the peak but once it identifies that the trend is continuing downward.
- Instead of predicting peaks or bottoms, the focus is on identifying and capitalizing on the market's prevailing direction or trend.
The Midcap Advantage
Midcaps are the sweet spot between large and small caps as they offer a blend of stability and growth. SEBI classifies the 101st to 250th companies by market capitalization as midcap companies. The chart below shows the 5-year risk-reward metrics between large, mid, and small caps, and proves that midcaps have historically offered better risk-reward.
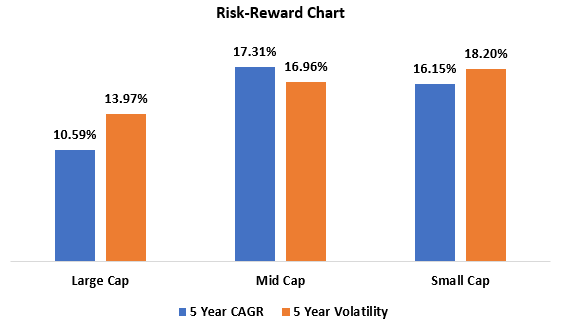
Source: BSE. BSE 100 Large Cap TRI represents large cap, BSE 150 Midcap TRI represents the midcap, while the small cap is represented by the BSE 250 Smallcap TRI.
Not All Midcaps deliver the same outcome
Midcaps can offer strong growth potential, but returns are not evenly distributed. Finding emerging leaders early may improve outcomes.
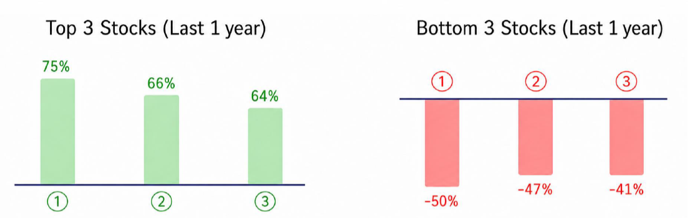
Source: MOSL Product presentation Top and Bottom 3 stocks are from the BSE 150 Midcap Index Source/Disclaimer: NSE, BSE. Data as on 30-Jun-26 The above graph is used to explain the concept and is for illustration purposes only and should not be used for development or implementation of an investment strategy.
Midcap Momentum: Growth meets Conviction
- Among market segments, momentum has delivered better performance when applied in midcap segment
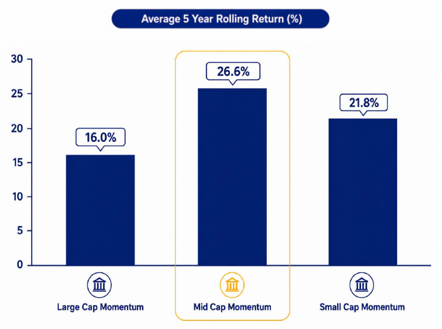
Source/Disclaimer: NSE,BSE. Performance as of close of 16-Dec-05 to 30-Jun-26 . 250 trading days assumed in one year. Outperformance % indicates the number of days out of total days alpha has been generated. (Momentum indices Large Cap Momentum: BSE Largecap 100 Momentum 30 TRI Mid Cap Momentum: BSE Midcap 150 Momentum 30 TRI Small Cap Momentum: BSE Smallcap 500 Momentum 50 TRI )
- Winning stocks often continue to outperform. Smaller companies grow faster than the large ones
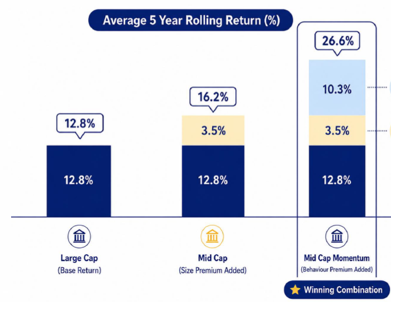
Source/Disclaimer: NSE,BSE. Performance as of close of 16-Dec-05 to 30-Jun-26 . 250 trading days assumed in one year. Outperformance % indicates the number of days out of total days alpha has been generated. Performance results have many inherent limitations and no representation is being made that any investor will, or is likely to achieve. Past performance may or may not be sustained in future and is not a guarantee of future returns. The above graph is used to explain the concept and is for illustration purpose only and should not used for development or implementation of an investment strategy. ( Large Cap : BSE 100 LargeCap TMC TRI Mid Cap : BSE 150 MidCap TRI Mid Cap Momentum: BSE Midcap 150 Momentum 30 TRI Winning stocks often continue to outperform Smaller companies grow faster than the large ones)
- Within the Midcap segment, momentum has delivered higher returns than other factor strategies
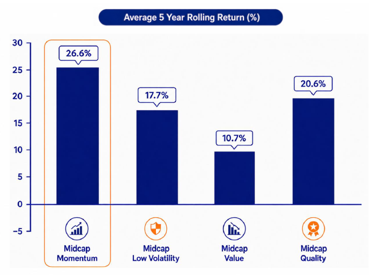
Source/Disclaimer: NSE,BSE. Performance as of close of 16-Dec-05 to 30-Jun-26 . 250 trading days assumed in one year. Outperformance % indicates the number of days out of total days alpha has been generated. Performance results have many inherent limitations and no representation is being made that any investor will, or is likely to achieve. Past performance may or may not be sustained in future and is not a guarantee of future returns. The above graph is used to explain the concept and is for illustration purpose only and should not used for development or implementation of an investment strategy. ( Large Cap : BSE 100 LargeCap TMC TRI Mid Cap : BSE 150 MidCap TRI Mid Cap Momentum: BSE Midcap 150 Momentum 30 TRI Winning stocks often continue to outperform Smaller companies grow faster than the large ones)
About the BSE Midcap 150 Momentum 30 Index
- The BSE Midcap 150 Momentum 30 Index is designed for a more focused momentum exposure (see graphic below). The Sharpe Ratio measures how much return a portfolio generates for each unit of risk taken. A higher Sharpe Ratio is better.
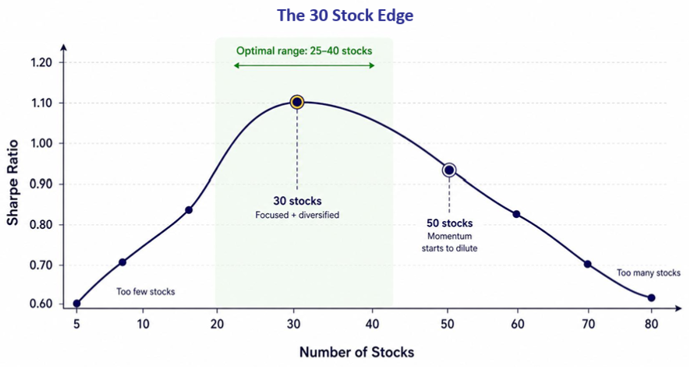
Source/Disclaimer: NSE, BSE. The above graph is used to explain the concept and is for illustration purpose only and should not used for development or implementation of an investment strategy. The above graph is an illustration based upon the findings from the report. For detailed report visit https://papers.ssrn.com/sol3/papers.cfm?abstract_id=4453680
- The Momentum Index takes higher exposure to sectors showing stronger trends, while avoiding sectors where momentum is currently weak or absent.
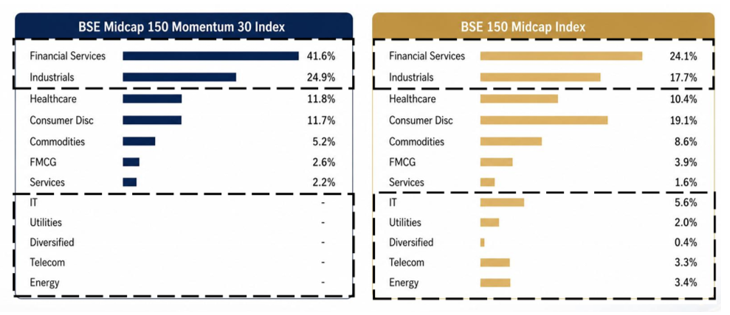
- The momentum index assigns higher weights to selected midcap leaders instead of spreading exposure broadly. The weight of the Top 10 stocks in the Momentum 30 index is 50% compared to 15.4% of the same 10 stocks weighed in the Midcap 150 Index.
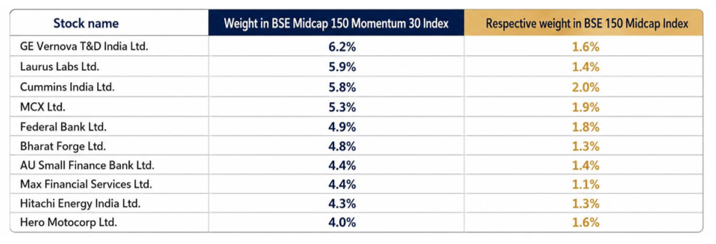
Source/Disclaimer: NSE,BSE. Data as on 31-May-26 The above graph is used to explain the concept and is for illustration purpose only and should not used for development or implementation of an investment strategy. The stocks/sectors mentioned above are used to explain the concept and is for illustration purpose only and should not be used for development or implementation of an investment strategy
BSE Midcap 150 Momentum 30 Index- Different than the Nifty Midcap 150 Momentum 50 Index
- Lower buffer with faster changes: Buffer is the extra room given to stocks before they are removed from the index. In momentum investing, trends change quickly. A lower buffer helps the index stay closer to the market leaders. The BSE Midcap 150 Momentum 30 Index has a smaller buffer compared to the Nifty Midcap 150 Momentum 50 Index helping in faster replacement.
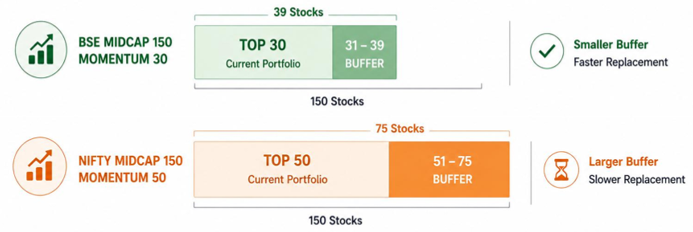
Source/Disclaimer: NSE, BSE. The above graph is used to explain the concept and is for illustration purpose only and should not used for development or implementation of an investment strategy. Buffer explanation has been in accordance with index methodology.
- Superior returns: Midcap 150 Momentum 30 has historically generated a meaningful excess return over Nifty Midcap 150 Momentum 50 with similar volatility
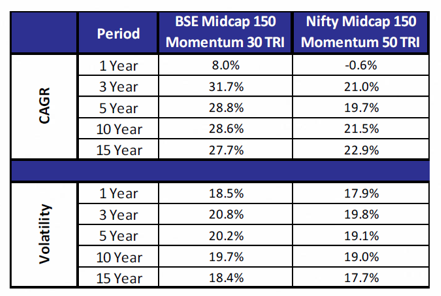
Source/Disclaimer: NSE,BSE. Performance as of close of 16-Dec-05 to 30-Jun-26 . 250 trading days assumed in one year Performance results have many inherent limitations and no representation is being made that any investor will, or is likely to achieve. Past performance may or may not be sustained in future and is not a guarantee of future returns. The above graph is used to explain the concept and is for illustration purpose only and should not used for development or implementation of an investment strategy.
Why should you invest in the BSE Midcap 150 Momentum 30 Index?
- Across all measured periods, BSE Midcap 150 Momentum 30 index has delivered higher CAGR than its parent index and Nifty 50.
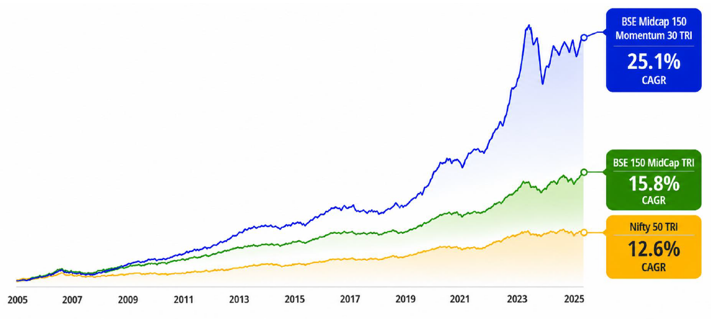
Source/Disclaimer: BSE. Performance as of close of 30-Jun-26. Performance results have many inherent limitations and no representation is being made that any investor will, or is likely to achieve. Past performance may or may not be sustained in future and is not a guarantee of future returns. The above graph is used to explain the concept and is for illustration purpose only and should not used for development or implementation of an investment strategy.
- Similar drawdown as the midcap broad market index: The chart below shows the drawdowns of BSE Midcap 150 Momentum 30 TRI Index versus the BSE Midcap 150 TRI. You can see that BSE Midcap 150 Momentum 30 TRI experienced similar drawdowns as BSE Midcap 150 TRI Index. The BSE Midcap 150 Momentum 30 TRI Index was able to deliver superior returns compared to BSE Midcap 150 TRI with similar downside risks; in other words, superior risk / return trade-off for investors.
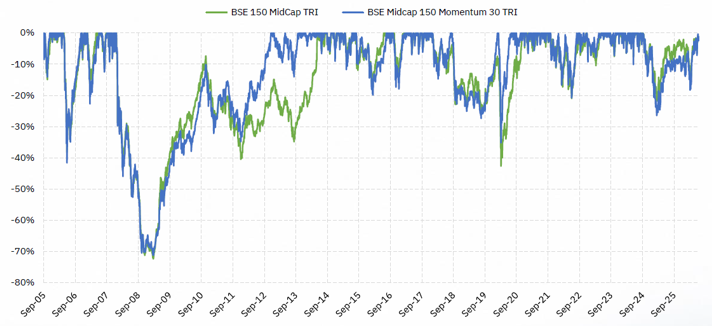
Source: NSE, Advisorkhoj Research, MOSL MF product presentation BSE. Performance as of close of 30-Jun-26. Performance results have many inherent limitations and no representation is being made that any investor will, or is likely to achieve. Past performance may or may not be sustained in future and is not a guarantee of future returns. The above graph is used to explain the concept and is for illustration purpose only and should not used for development or implementation of an investment strategy
Motilal Oswal BSE Midcap 150 Momentum 30 Index Fund
The Motilal Oswal BSE Midcap 150 Momentum 30 Index Fund is an open-ended fund replicating the BSE Midcap 150 Momentum 30 Index. The fund is managed by Fund Managers Mr. Swapnil Mayekar Mr. Dishant Mehta (Associate Fund Manager)- For Equity Component and the Debt Component is managed by Mr. Rakesh Shetty.
Stock Selection Methodology
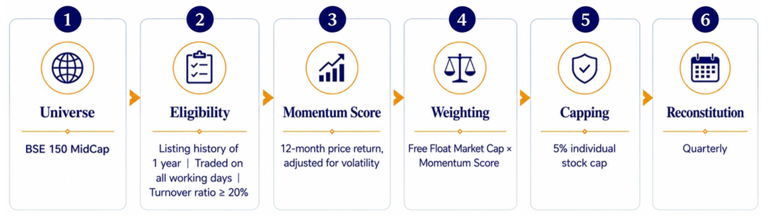
The scheme consists of 30 stocks systematically selected in the following way.
Current Composition
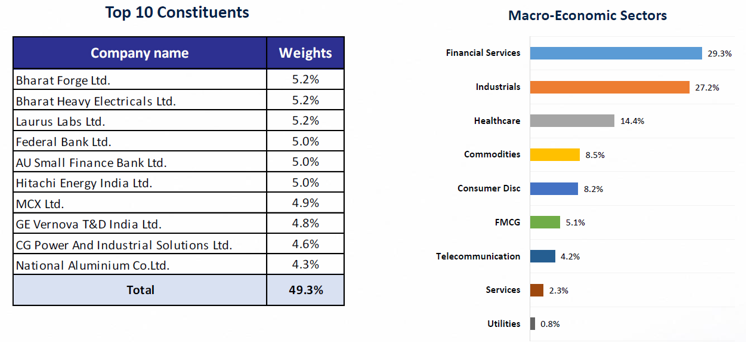
Source/Disclaimer: NSE,BSE. Data as on 30-Jun-26 The above graph is used to explain the concept and is for illustration purpose only and should not used for development or implementation of an investment strategy. The stocks/sectors mentioned above are used to explain the concept and is for illustration purpose only and should not be used for development or implementation of an investment strategy.
Who should invest in the Motilal Oswal BSE Midcap 150 Momentum 30 Index Fund ?
The fund may be suitable for:
- Investors looking for capital appreciation over long investment tenures through passive investing.
- Investors who want to invest in a factor index based on momentum strategy.
- Investors with very high-risk appetites.
- You should have a minimum investment tenure of 3 to 5 years.
Investors should consult with their financial advisors or mutual fund distributors if the Motilal Oswal BSE Midcap 150 Momentum 30 Index Fund aligns with their investment needs.
FAQs
Q1. What is the Motilal Oswal BSE Midcap 150 Momentum 30 Index Fund?
An open-ended index fund that replicates the BSE Midcap 150 Momentum 30 Index of 30 highest-momentum stocks from the BSE 150 Midcap universe, selected through a systematic momentum-scoring methodology and rebalanced quarterly.
Q2. What index does this fund track?
This fund tracks the BSE Midcap 150 Momentum 30 Index – a rules-based index of 30 highest-momentum stocks from the BSE 150 Midcap universe, rebalanced quarterly based on 12-month price returns adjusted for volatility, with free-float market cap weighting capped at 5% per stock.
Q3. Why only 30 stocks?
Fewer stocks create excessive concentration and higher volatility. More stocks dilute the momentum signal into a broad index. The 30-stock portfolio delivers the best risk-adjusted returns.
Q4. Is midcap momentum a risky strategy?
Midcap momentum carries both midcap volatility and momentum reversal risk. However, the strategy is rules-based, with periodic rebalancing to stay with stronger trends and remove weaker stocks over time.
Q5. Who should consider this fund?
Investors who:
- Seek growth (5+ year horizon)
- Can tolerate midcap volatility
- Believe in systematic momentum strategies
- Want concentrated, high-conviction exposure
Q6. How often does the portfolio change?
The portfolio rebalances quarterly (March, June, September, December) as momentum leadership shifts across sectors and stocks. During each rebalancing, the portfolio adapts to refresh momentum rankings, keeping it aligned with current market trends while maintaining the 30-stock focused structure.
Q7. Why quarterly rebalancing instead of semi-annual?
Quarterly rebalancing enables faster adaptation to market trend shifts. When momentum leadership rotates, quarterly rebalancing captures the shift within weeks, not months. Faster responsiveness drives alpha.
Q8. What is the buffer zone and why does it matter?
A buffer zone helps reduce unnecessary portfolio changes in a index. It ensures stocks are not removed only because of small rank movements, while still allowing weaker momentum stocks to be replaced when the trend meaningfully changes.
Q9. Can I invest through SIP?
Yes. Multiple SIP frequency options are available. SIP is a particularly good fit for a volatile thematic fund.
Q10. What is the exit load?
1% exit load if redeemed within 15 days from date of allotment. Zero exit load after 15 days. No exit load charged on switches between options within the scheme.
Mutual Fund Investments are subject to market risk, read all scheme related documents carefully.
RECOMMENDED READS
- Motilal Oswal Midcap Fund: 7 point 4X in 10 years
- Motilal Oswal Multi Factor Passive FOF: Navigate market cycles with multi factor strategy
- Look beyond Nifty 50: Explore the Benefits of Investing in the Nifty 500 Index
- Why index funds make a good investment choice
- Motilal Oswal Consumption Fund: Potential for long term growth from consumption story
LATEST ARTICLES
- Motilal Oswal Small Cap Fund: Outperforming benchmark and peers
- Motilal Oswal BSE Clean Environment Index Fund NFO: Investment in the Future of Clean Energy
- Motilal Oswal Contra Fund NFO: Contrarian Strategy for long term wealth creation amidst volatility
- Motilal Oswal Large and Midcap Fund: Growth stability and high quality
- Motilal Oswal Multi Factor Passive FOF: Navigate market cycles with multi factor strategy

Motilal Oswal Asset Management Company Ltd. (MOAMC) is a public limited company incorporated under the Companies Act, 1956 on November 14, 2008, having its Registered Office at 10th Floor, Motilal Oswal Tower, Rahimtullah Sayani Road, Opposite Parel ST Depot, Prabhadevi, Mumbai - 400025. Motilal Oswal Asset Management Company Ltd. has been appointed as the Investment Manager to Motilal Oswal Mutual Fund by the Trustee vide Investment Management Agreement (IMA) dated May 21, 2009, executed between Motilal Oswal Trustee Company Ltd. and Motilal Oswal Asset Management Company Ltd.
Investor Centre
Follow Motilal Oswal MF
More About Motilal Oswal MF
POST A QUERY