Investing in equity funds at all time market high
Over the last few days the Nifty 50 has made a new all-time high. This is wonderful news for investors in equity funds, but if you tune into business channels on your TV, you will hear expert voices concerned about stock valuations and earnings growth not able to meet expectations. Based on our observation of investor behaviour in India over the past 15 years, there are usually two types of feelings when the market makes an all-time high. The most common feeling is one of excitement; mutual funds have usually received record inflows in the years the market made all-time highs. However, some people view all-time highs with trepidation and are concerned whether a correction is imminent. In this post, we will discuss how to go about equity investing when the market is at an all-time high.
At the very outset, I would like to say that, if you are investing your monthly savings regularly in equity for your long term goals through Systematic Investment Plans (SIPs), then the market level is irrelevant because in the long term you will average out the purchase price. If there is volatility in the market, as many experts are predicting, you will benefit for it through SIP. So, if you are investing in equity mutual funds through SIP, you should continue investing till your goal is achieved. In the rest of this post, we will discuss how to invest lump sum money at all-time market highs.
Asset Allocation View
I have discussed the importance of asset allocation a number of times in my blog. Optimal asset allocation is a function of our risk capacity and financial goals. Often in bull markets, encouraged by profit people invest large sums of money in stocks and mutual funds. However, now that, the market is at an all-time and most equity fund investors would have made profits or at least have recovered their losses, it is a good time to look at asset allocation to see if your asset mix is optimal and invest accordingly.
At the same time, there are many investors in India, who have either have not invested in equities at all or are substantially under-invested in equities (Vis a Vis their optimal asset allocation). Such investors should invest in equities for their long term financial goals, irrespective of market levels. As we have repeated often in our blog, equity has historically been the best performing asset class in the long term (we will touch upon this again later in this post). If such investors are worried about valuations, then there are systematic investing mechanisms which can address their concerns (we will discuss this in more details later).
What about alternative asset classes like gold, real estate, international stocks etc.? Let us briefly discuss each of these asset classes in the current economic and market context. Gold, purely from an investment perspective, has underperformed both debt and equity by a significant margin for several years now. In the last one year gold has given just 1.7% returns; in the last three and five years, gold gave just 0.5% and 0.7% annualized returns respectively, much lower than the risk-free rate.
The real estate sector in India has been in a severe recession for quite a few years now and real estate is one of the worst performing asset classes in the last several years. Prices have virtually been stagnant or even declined in many cities like NCR region, Bengaluru etc. in the last 4 – 5 years; real estate has lost its favour with investors and the situation is not going to improve very soon.
Global equities (barring China) have done well and you can add international equity funds to your portfolio for the sake of diversification, but investors around the globe believe that, India is one of the brightest spots in the global equity market. Purely from a performance perspective, domestic (Indian) equity is a clear winner compared to international equity funds.
We believe that, fixed income (debt) and equity are the two best asset classes for investors. The choice between fixed income and equity investing should be governed by your optimal asset allocation mix (versus your current mix) and your short term, medium term and long term investment goals. Investors should also know that, asset classes have different growth rates over different time-scales and asset rebalancing (between debt and equity) is an important factor in ensuring success towards long term financial goals.
Staircase pattern of equity prices
When share prices are at an all-time high two outcomes are possible; either stocks will create new highs or decline. No one can predict what will happen in the short term; if it was possible to predict, then market cycles would have been very mild. Bull market rallies and bear market crashes globally, have shown us that, market cycles are anything but mild. The long term trend of equity prices is more relevant for you, as a mutual fund investor because equity mutual fund investments should always be for the long term.
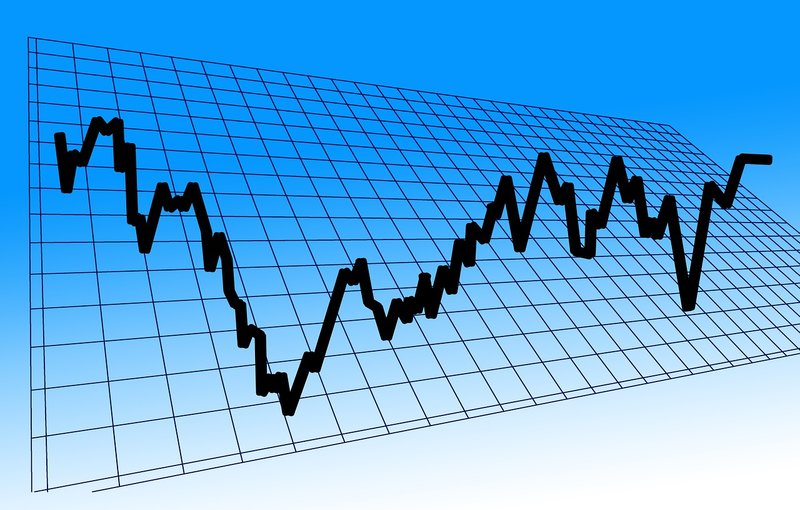
We have seen that, in the long term, equity prices follow a staircase pattern. The chart below shows the monthly closing price of the Sensex over the past 25 years.

Source: Bombay Stock Exchange
Readers can notice that, we have connected market tops with straight lines. You will see that, the series of the lines connecting the tops resemble steps of a staircase. You can see that, the market makes a top, then declines and then rises again and makes a fresh top. Sometimes the share prices make a big jump from one step to another and at other times, it makes a small jump, but over a sufficiently long period, the steps take you up and up.
The chart above encapsulates the essence of equity investing which is that, the market direction, however, is rarely unidirectional or straight line; the 2004 to early 2008 was an exceptional period for equities, when we had a fabulous bull run. Whether the bull market of 2004 to 2007 will be re-enacted in the future, is something we have to wait and see, but the steps (big or small) of the staircase, as depicted in the chart above, reinforces what we stated earlier that, equity is the best performing asset classes in the long run. Ignoring the early nineties, when our market was not fully matured, you can see in the chart above that, if you had a very long investment horizon (say 10+ years), you could have invested at market peaks and still got good returns.
Attitude towards risk is an important quality in equity investing. I do not know where Nifty will be, by the end of this year, or end of next year or even 3 years from now, but I can guarantee one thing – we will have a bear market in the future. Bear markets test our patience and resilience; more so, if we need access to liquidity to meet a financial goal in a bear market year; that is why appropriate asset allocation is very important. Patience, however, is a very important behavioural attribute in long term investing and you will surely be rewarded.
Mix of large cap and midcap
The terrific performance of midcaps in 2014 and their relative resilience during the bear market of 2015 – 16, led to a situation where the midcap stocks were trading at a premium (in terms of valuations) relative to large cap stocks. Even in the last one year, after the market has recovered, large cap funds as a category has given an average 24% returns; multi-cap funds (which have both large cap and midcap stocks) as category has given an average 29% returns; midcap funds as a category has given an average 33% returns while small cap funds have given 36% returns (please see our Mutual Fund Category Monitor).
There is a saying in the market that, when the going is good, it is easy to make money, but easy money opportunities are limited in the market. Mutual fund investors would have made good profits by investing in midcap and small cap funds, but investors cannot disregard the valuation premiums enjoyed by midcap over large cap stocks. The Sensex is trading at a P/E ratio of 23, the BSE – 100 at 25, while the BSE Midcap Index is trading at a P/E ratio of 31. This situation has persisted for a couple of years now, but generally speaking this is an unusual situation. Some of our readers may be aware that, some small and midcap equity mutual fund schemes have stopped accepting fresh lump sum investments. Many investment experts are concerned that a sharp correction will affect midcap stocks more than large cap stocks. As such a prudent mix of large cap, midcap and small cap funds is needed to balance risk and returns.
On the other hand, there are a number of positives in the Indian market context which work in favour of small and midcap stocks and funds. Small and midcap funds are relatively more immune to global developments and risk sentiments compared to large cap funds. The universe of small and midcap stocks is quite large and fund managers may be able to identify pockets of growth and value opportunities in the small and midcap segments. In our view, a multi-cap strategy is best suited in the current environment. Diversified equity or multi-cap funds are usually large cap oriented, but they also invest in midcap (or small cap) stocks. The mix of large caps and midcaps is driven either by purely a bottoms-up stock picking approach or the outlook of the fund manager regarding the relative valuations of the different market segments and their relative earnings growth potential.
Smart investment strategy
Let us revisit the 25 year Sensex chart. You will observe that, post 2007 the market has been much more volatile than it has been in the past. Many market observers say that, this is the new reality of equity markets. A veteran stock broker told me many years back, that traders love volatility but investors hate it. We believe that, even investors can take advantage of volatility. Systematic investing is a simple, yet smart strategy to deal with volatility.
Take 2016 for instance; the Sensex was around 24,900 at the beginning of that year, it fell 23,000 levels (almost a 9% drop), rose to 28,500 by and then fell to 26,500 by the year end. I know that, many smart investors were expecting volatility in 2016 and so, they invested their lump sum money through Systematic Transfer Plan (STP). These investors got fantastic returns on their investments over the past year or so.
In an STP, the investor invests in a low risk, no load fund, usually a money market mutual fund (like liquid fund or ultra short term debt fund) and transfer fixed amounts to an equity fund at regular intervals over a specified terms (few months or a year). A monthly interval is most common, but some investors choose multiple dates every month (two or more), to take advantage of price changes within the month; it is a wise strategy. Through STPs, investors can take advantage of volatility when investing in equity funds and, at the same time, get steady returns on the money which is invested in debt or money market mutual funds.
Returns of money market mutual funds are much higher than savings bank interest rate. STP works best over a short time-frame, few months to a year, during which the market is expected to remain volatile; over a longer time-frame, STP loses its effectiveness, because the investor ends up buying units at higher and higher prices. Please use our STP Calculator and you will see, how effectively STP has worked in different time periods. You can also keep track of how well your STP strategy is working by using our STP Calculator
We think that, STP may be a good strategy even in FY 2018, when the markets are at an all-time high and possible headwinds (stretched valuations, earnings related concerns, uncertain interest rate environment, inflation, possibility of weak monsoon etc.). One of the big talking points in the market in the last 2 years or so is the Non-Performing Assets (NPA) situation of the banks, particularly public sector banks. The public sector bank stocks have rallied over the past month or so in anticipation of a speedy resolution of the NPA issue by the Government. If the market sees some positive outcomes arising out of the Government’s actions, then the market may scale new highs. Investors should also keep track of meteorological forecasts of monsoon this year, actions of the US Federal Reserve and the action on the crude front (particularly OPEC’s production related decisions).
Conclusion
As mentioned earlier, STP works best in a certain time-frame. If you see a break-out from a range bound market, then STP will no longer be effective and you should switch your remaining units from the low risk fund (e.g. liquid fund) to equity fund, as soon as possible. In order to spot a break-out early enough, you should keep track of the markets, not necessarily on a daily basis, but on a regular basis, say a few times every month. You should also understand the reasons for the break-out from a certain price pattern. Keep following us and we will help you in keeping track of the market. You should also make sure that, your asset allocation is optimal and that you have a good mix of various market cap segments in your investment portfolio. We wish you the very best in your investment journey in FY 2018.
Disclaimer:
Any information contained in this article is only for informational purpose and does not constitute advice or offer to sell/purchase units of the schemes of SBI Mutual Fund. Information and content developed in this article has been provided by Advisorkhoj.com and is to be read from an investment awareness and education perspective only. SBI Mutual Fund’s participation in this article is as an advertiser only and the views / content expressed herein do not constitute the opinions of SBI Mutual Fund or recommendation of any course of action to be followed by the reader
Mutual Fund Investments are subject to market risk, read all scheme related documents carefully.
RECOMMENDED READS
- Demystifying debt mutual funds
- Why Balanced Funds may be the best investments for new mutual fund investors
- How do you know if you have good funds in your mutual funds portfolio: part 1
- Know your mutual fund tax obligations to manage your investments effectively
- Asset Allocation is much more important than fund selection
LATEST ARTICLES
- SBI Large and Midcap fund: Potential for Long Term Wealth Accumulation
- SBI Focused Fund: On a strong performance upturn
- SBI Quality Fund: Invest in the long term growth potential of Quality Stocks
- SBI Dynamic Asset Allocation Active FOF: A smart asset allocation solution in shifting markets
- Your perfect Gift for your little ones this Childrens Day: SBI Magnum Childrens Benefit Fund Investment Plan One of the best performing funds for your childs future
Quick Links
Follow SBI MF
More About SBI MF
POST A QUERY