
Risk Indicators in Mutual Funds
Mutual funds are market linked investments. The prices of the underlying securities e.g. stocks, bonds etc of a mutual fund scheme can go up or down depending on market movement. The Net Asset Value (NAV) of a scheme reflects the market value of the underlying securities. Accordingly, the NAV of a scheme can go up or down depending on market movements. Mutual fund investors should understand the disclaimer, “Mutual Funds are subject to market risks”. However, the risk is not the same in all schemes.
You may read understanding mutual fund NAVs
In this blog post, we will discuss about different risk indicators in mutual funds.
What is risk in investments?
According to FINra, a self regulatory organization for brokers in the United States, risk is defined as “Risk is any uncertainty with respect to your investments that has the potential to negatively impact your financial welfare”. In other words, risk is possibility of making a loss in your investments.
Asset class risk
An asset class is a group of investments with similar risk / return characteristics. Examples of asset classes are equity, fixed income (debt), gold, real estate etc. Different asset classes have different risk profiles. Fixed income has lower risks compared to equity and gold; equity has higher risks compared to gold and fixed income. It is important for investors to understand that risk and returns are interrelated; higher the risk, higher the potential returns. You should always invest in the right asset class, according to your investment needs and risk appetite. If your investments are spread across the multiple asset classes, you should ensure that your asset allocation is aligned with your risk appetite.
Risks in equity and equity oriented mutual funds
There are two types of risk in equity mutual funds:-
- Systematic risk is the risk associated with the entire market; systematic risk is also known as market risk. Market risk cannot be diversified. All equity funds and hybrid funds which have asset allocation in equities are subject to market risks.
- Unsystematic risk is the risk associated with individual stocks or market sectors. Mutual funds reduce unsystematic risks to a large extent through diversification. However, there are some unsystematic risks in actively managed equity and hybrid funds because the fund managers are usually overweight / underweight on certain stocks / sectors relative to the market benchmark index because the fund manager wants to beat the benchmark – create alphas. However, passive funds like Exchange Traded Funds (ETF) and Index Funds do not have unsystematic risks because they invest in a basket of securities that replicate the market index. ETFs and index funds are only subject to market risks.
You may also like to read what should you do when the stock markets are at high level?
Risk indicators in equity oriented mutual funds
We will focus on some common risk indicators, which you can easily find in the mutual fund factsheets. For the benefit of layman investors, we will not delve into the mathematical intricacies of these risk indicators. You should know how to use these risk indicators in making informed investment decisions.
- Standard Deviation: Standard deviation is a measure of dispersion of a mutual fund scheme’s monthly returns from its average return. It is a measure of volatility of the scheme. Higher the standard deviation, higher is the risk.
- Sharpe Ratio: Sharpe Ratio is the excess of average returns over risk free rate (e.g. T-Bill yield, overnight interbank rate like MIBOR etc) divided by the standard deviation.Sharpe Ratio is a measure of risk adjusted returns. Higher the Sharpe Ratio, higher is the risk adjusted return.
- Beta: Beta is the risk of a stock or mutual fund scheme relative to the relevant market benchmark. We will explain beta with the help of an example. Let us assume the beta of a scheme is 1.2. If the market benchmark rises by 5% in a month, then the scheme will rise by 6% but if the market benchmark falls by 5% in a month, then the scheme will fall by 6%. Higher the beta, higher is the risk.
- Alpha: The alpha is the excess return over market benchmark adjusted for risk. It is the extra return generated by the fund manager through active stock selection. We will explain alpha with the help of an example. Let us assume the alpha of a scheme is 2% and beta is 1.2. If the benchmark return is 10%, then scheme return will be = 2% + 10% X 1.2 = 14%. If benchmark return is -5%, then scheme return will be = 2% - 5% X 1.2= - 4%. Higher the alpha, higher is the risk adjusted return.
Risk in debt mutual funds
There are mainly two types of risks in debt mutual funds:-
- Interest rate risk: Market price of debt instruments e.g. bonds, Non Convertible Debentures (NCD) etc, have an inverse relationship with interest rate movements. If interest rates go up, then bond prices and debt scheme NAVs will fall and vice versa.
- Credit risk: Credit risk of fixed income instruments refers to the issuers’ failure of meeting their interest and / or principal payment obligations, exposing the investor to potential loss of income and / or capital. If the issuer defaults on interest and principal payments then the price of the instrument will be written down permanently in the debt scheme’s NAV and the investor may have to suffer a loss.
Risk Indicators in debt mutual funds
- Maturity or Duration: Longer the maturity or duration of a bond, higher is the interest rate risk – same applies to debt funds also. A long duration fund will have higher interest rate risk compared to a short duration funds, but the longer duration fund can give higher returns over long investment tenures since yields of longer duration funds are usually higher than shorter duration funds. You will find the duration and / or maturity profile of the scheme in the fund factsheet. You should invest according to your risk appetite and investment tenure.
- Credit Quality: Credit rating agencies assess credit risk and assign credit ratings to debt or money market instruments like commercial papers (CPs), certificates of deposits (CDs), NCDs etc. You should know that lower rated papers will give higher yields compared to highly rated papers but the credit risk will also be higher. Asset Management Companies (AMCs) disclose credit ratings of their debt and money market holdings for individual schemes in the fund factsheets. You should understand the credit risk and make informed investment decisions.
Suggested reading – Should you invest in debt funds when interest rates are rising
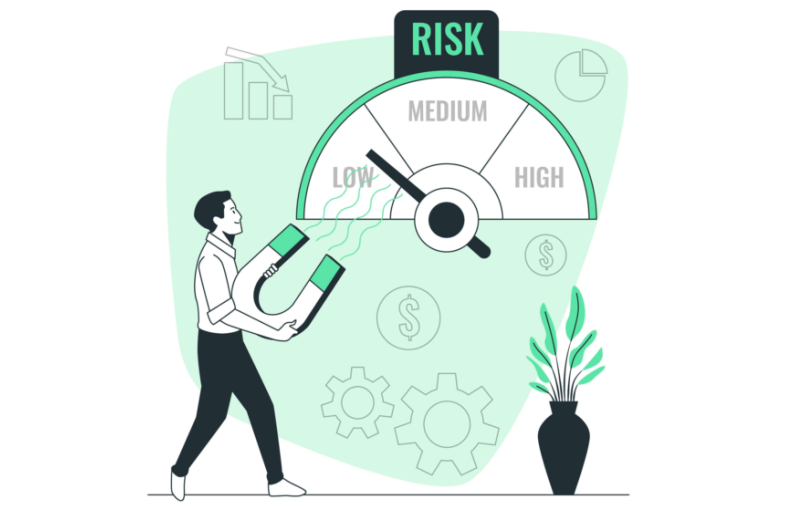
Riskometer
Riskometer is a pictorial representation of the level of risk of a specific scheme. Every AMC has to indicate the risk level of every scheme, existing or to be launched, as per the Riskometer. The Riskometer for every product / scheme is found on the monthly fund factsheets; it is also found in the AMC websites. In October 2020, SEBI refined the Riskometer further to capture the granular risks associated with mutual fund schemes. Schemes are now classified under low, low to moderate, moderate, moderately high, high and very high risk in Riskometer. In August 2021, SEBI issued a circular revising the Riskometer to determine risk based on actual underlying securities of a scheme using market capitalisation, volatility and liquidity as risk assessment parameters. Investors can use the Riskometer to get an understanding of risk at the scheme level.
You may also like to read how to choose the right mutual funds according to your need
Mutual Fund Investments are subject to market risk, read all scheme related documents carefully.
RECOMMENDED READS
Sundaram Asset Management Company is the investment manager to Sundaram Mutual Fund. Founded 1996, Sundaram Mutual is a fully owned subsidiary of one of India's oldest NBFCs - Sundaram Finance Limited.
Quick Links
- Interview - Mr. Dwijendra Srivastava - CIO - Fixed Income
- Interview - Mr. Sunil Subramaniam - CEO
- Sundaram Select Midcap Fund: Consistent outperformance makes it a big wealth creator
- Interview - Mr. Sunil Subramaniam - CEO
- Fund Manager Interview - Mr. Krishna Kumar - CIO - Equities
- Sundaram Rural India Fund: This thematic Mutual Fund aiming good long term returns
- Sundaram Equity Multiplier: Long term wealth creation potential
- Our Articles
- Our Website
- SIP one sheeter-Investor Education initiative
- Sundaram Asset Management Singapore
- Returns Calculator
- SEBI Investor Awareness Initiative
- Check your KYC Status
- KYC Forms & FAQs
- Recieve your PIN
- A note on NIGO
- FAQs on RGESS
- FAQs on Direct Plan
- Receive Updates
- Share your views
- Transmission Checklist
- Equity Application Form
- Fixed Income Application Form
- Transaction Slip
- Factsheet May - 2016
- MF Tax Reckoner 2015
Follow Sundaram MF
More About Sundaram MF
POST A QUERY


