
Do not go by short term performance when selecting a mutual fund

We have often heard that recent performance of a mutual fund is not always a good indicator of future performance. Yet some financial advisers cite last one year returns when selling mutual funds. In this article, we will analyze if short term performance is a good indicator of future performance with actual data. To do this analysis objectively, we will employ a technique known as back testing. Back testing is the process of testing a trading or investment strategy on prior time periods. For our analysis, let us go back to the past, to 2011. We will test if investing in funds based on last one year performance (e.g. 2010 performance), gave good results over the next 3 years. For our analysis, we have chosen the universe of large cap funds. We have restricted ourselves to growth options in regular plans. Direct plans give slightly higher returns, but the results of our analysis will not change. The chart below shows the returns from large cap funds in various years.
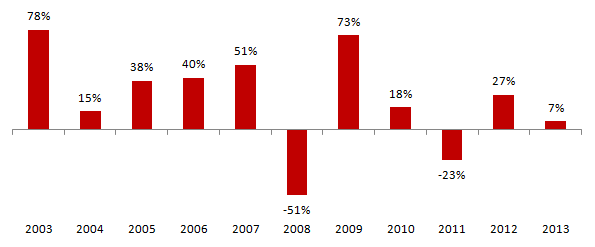
2010 was a good year for mutual funds. The average return for large cap funds as a category was 18%. For our back testing analysis, let us assume that we are in January 1 2011. We will look at the universe of large cap funds in 2010 and identify top performers on the basis of 1 year returns. At first, let us look at the top 5 performers in 2010 and compare their 2010 returns with their compounded annual returns from 2011 to 2014 March Year-To-Date. Please see the chart below.
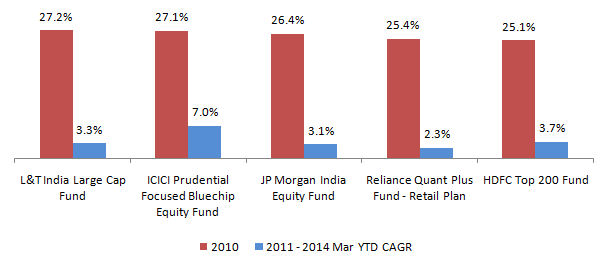
L&T India Large Cap fund was the best performer in 2010 with 27.2% returns. From 2011 to 2014 Mar Year-To-Date (YTD), the fund gave a return of 3.3%. At first glance, the return does not look very good. In fact, the 2011 – 2014 Mar YTD annualized returns from ICICI Prudential Focused Bluechip Equity fund is much higher than L&T India Large Cap fund.
But to understand, how these funds performed relative to other funds across various time periods, we will put funds in four performance quartiles for each time period (please refer to our article, Choose Best Mutual Funds wisely: A big performance differential between top and bottom performers). Funds in the top quartile in a particular period were the best performers, and those in the bottom quartile, were the worst performers. The table below lists the funds in the top and bottom performance quartiles based on the 2010 returns. There are 14 funds in the top quartile and 14 in the bottom, out of the total 56 large cap funds in 2010.
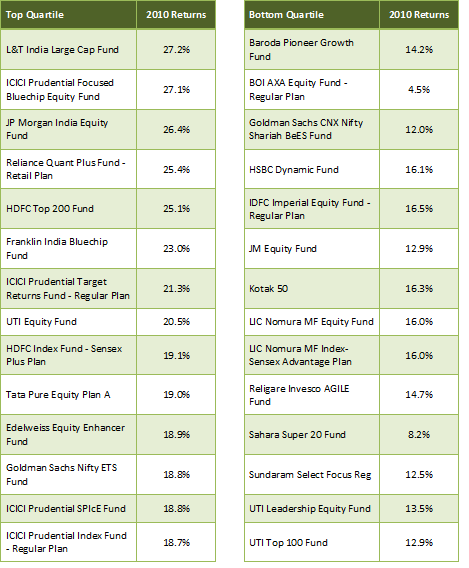
As you can see funds in the top quartile gave returns of over 18.7%. The funds in the bottom quartile gave returns less than 16.5%. However, there were funds in the bottom quartile that gave low single digit returns. The performance of funds, even in the bottom quartile, shows quite a bit of variation among themselves. However, we are not bothered about the funds in the bottom quartile. For our back testing we will choose the funds in the top quartile for our investment in January 1 2011 and see how they have performed till Mar 31, 2014. In terms of absolute returns, you may or may not be satisfied with the returns of these funds, depending on what your individual expectations are. But for the purpose of our analysis, we will look at the relative performance of these funds versus their peers.
Let us now look at the 2011 – 2014 Mar YTD compounded annualized returns of the same set of 56 large cap funds, which we analyzed for 2010 performance. We have deliberately excluded new funds launched after 2010, since we would not have been able to invest in these funds on January 1 2011. We will put the 56 large cap funds in 4 performance quartiles based on their 2011 – 2014 Mar YTD compounded annualized returns. The table below lists the 14 funds in the top performance quartile and 14 funds in bottom performance quartiles.
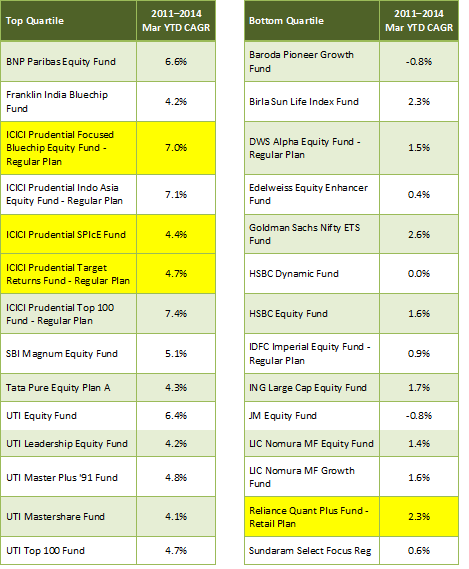
As you can see funds in the top quartile gave returns of over 4.1%. The funds in the bottom quartile gave returns less than 2.6%. Now let us see, how many funds in the top quartile based on 2010 returns figures in the 2011 – 2014 Mar YTD top performance quartile. Only three funds, highlighted in yellow, from the top quartile based on 2010 performance figured in the 2011 – 2014 Mar YTD top performance quartile. Let us see if any fund in the 2010 top quartile figured in the 2011 – 2014 Mar YTD bottom quartile. One fund from the top quartile based on 2010 performance actually figured in the 2011 – 2014 Mar YTD bottom performance quartile (see row highlighted in yellow, in the 2011 – 2014 Mar YTD bottom quartile table). This back-testing demonstrates that you should not rely on last one year performance when selecting a mutual fund.
Conclusion
As discussed in this article, paying too much importance to recent performance is risky. If you are switching funds based on short term performance, you may be selling a good fund and moving to a not-so-good fund. There are a number of factors that play an important role in determining future performance, e.g. fund manager track record, AMC track record, long term performance etc. Please refer to our article, How to effectively decode a mutual fund factsheet Part 1 Equity Funds, to get an overview of some of the performance related factors for equity funds. We will discuss the performance related factors in more details in subsequent articles.


Queries
-
What is the benefit of mutual fund STP
Aug 29, 2019
-
How much to invest to meet target amount of Rs 2 Crores
Aug 26, 2019
-
Can I achieve my financial goals with my current mutual fund investments
Aug 24, 2019
-
Can you tell me return of various indices
Aug 19, 2019
-
What would be the post tax return on different investments
Aug 18, 2019
-
Which Principal Mutual Fund scheme will be suitable for my retirement corpus
Aug 16, 2019
-
What is the minimum holding period for availing NCD interest
Aug 4, 2019
Top Performing Mutual Funds

Recommended Reading


Fund News
-
Invesco Mutual Fund launches Invesco India Nifty Bank ETF
Jul 28, 2026 by Advisorkhoj Team
-
Invesco Mutual Fund launches Invesco India BSE Sensex ETF
Jul 28, 2026 by Advisorkhoj Team
-
DSP Mutual Fund launches DSP BSE MidSmall Private Banks ETF
Jul 28, 2026 by Advisorkhoj Team
-
SBI Mutual Fund launches SBI Nifty Midcap 150 Momentum 50 ETF FOF
Jul 27, 2026 by Advisorkhoj Team
-
Edelweiss Mutual Fund launches Edelweiss BSE LargeMid 60 40 Stable dividend 50 ETF
Jul 27, 2026 by Advisorkhoj Team


